Despite an overall increase in expenditure and staffing, the ACT has the fewest police officers and the lowest recurrent expenditure per 100,000 people in the country. The ACT has the consistently lowest rate for clearance of property offences, for the 10th year running. Crime rates for sexual assault and motor vehicle theft have increased. Magistrates court decisions resulting in the conviction of defendants are the lowest in the nation. And the ACT public’s satisfaction with services provided by police is at its lowest in 10 years.
However, ACT residents place high trust in police integrity, and generally consider the ACT a safe place to live.
Those are some of the findings of the Report on Government Services, produced by the Australian Government’s Productivity Commission, published this week.
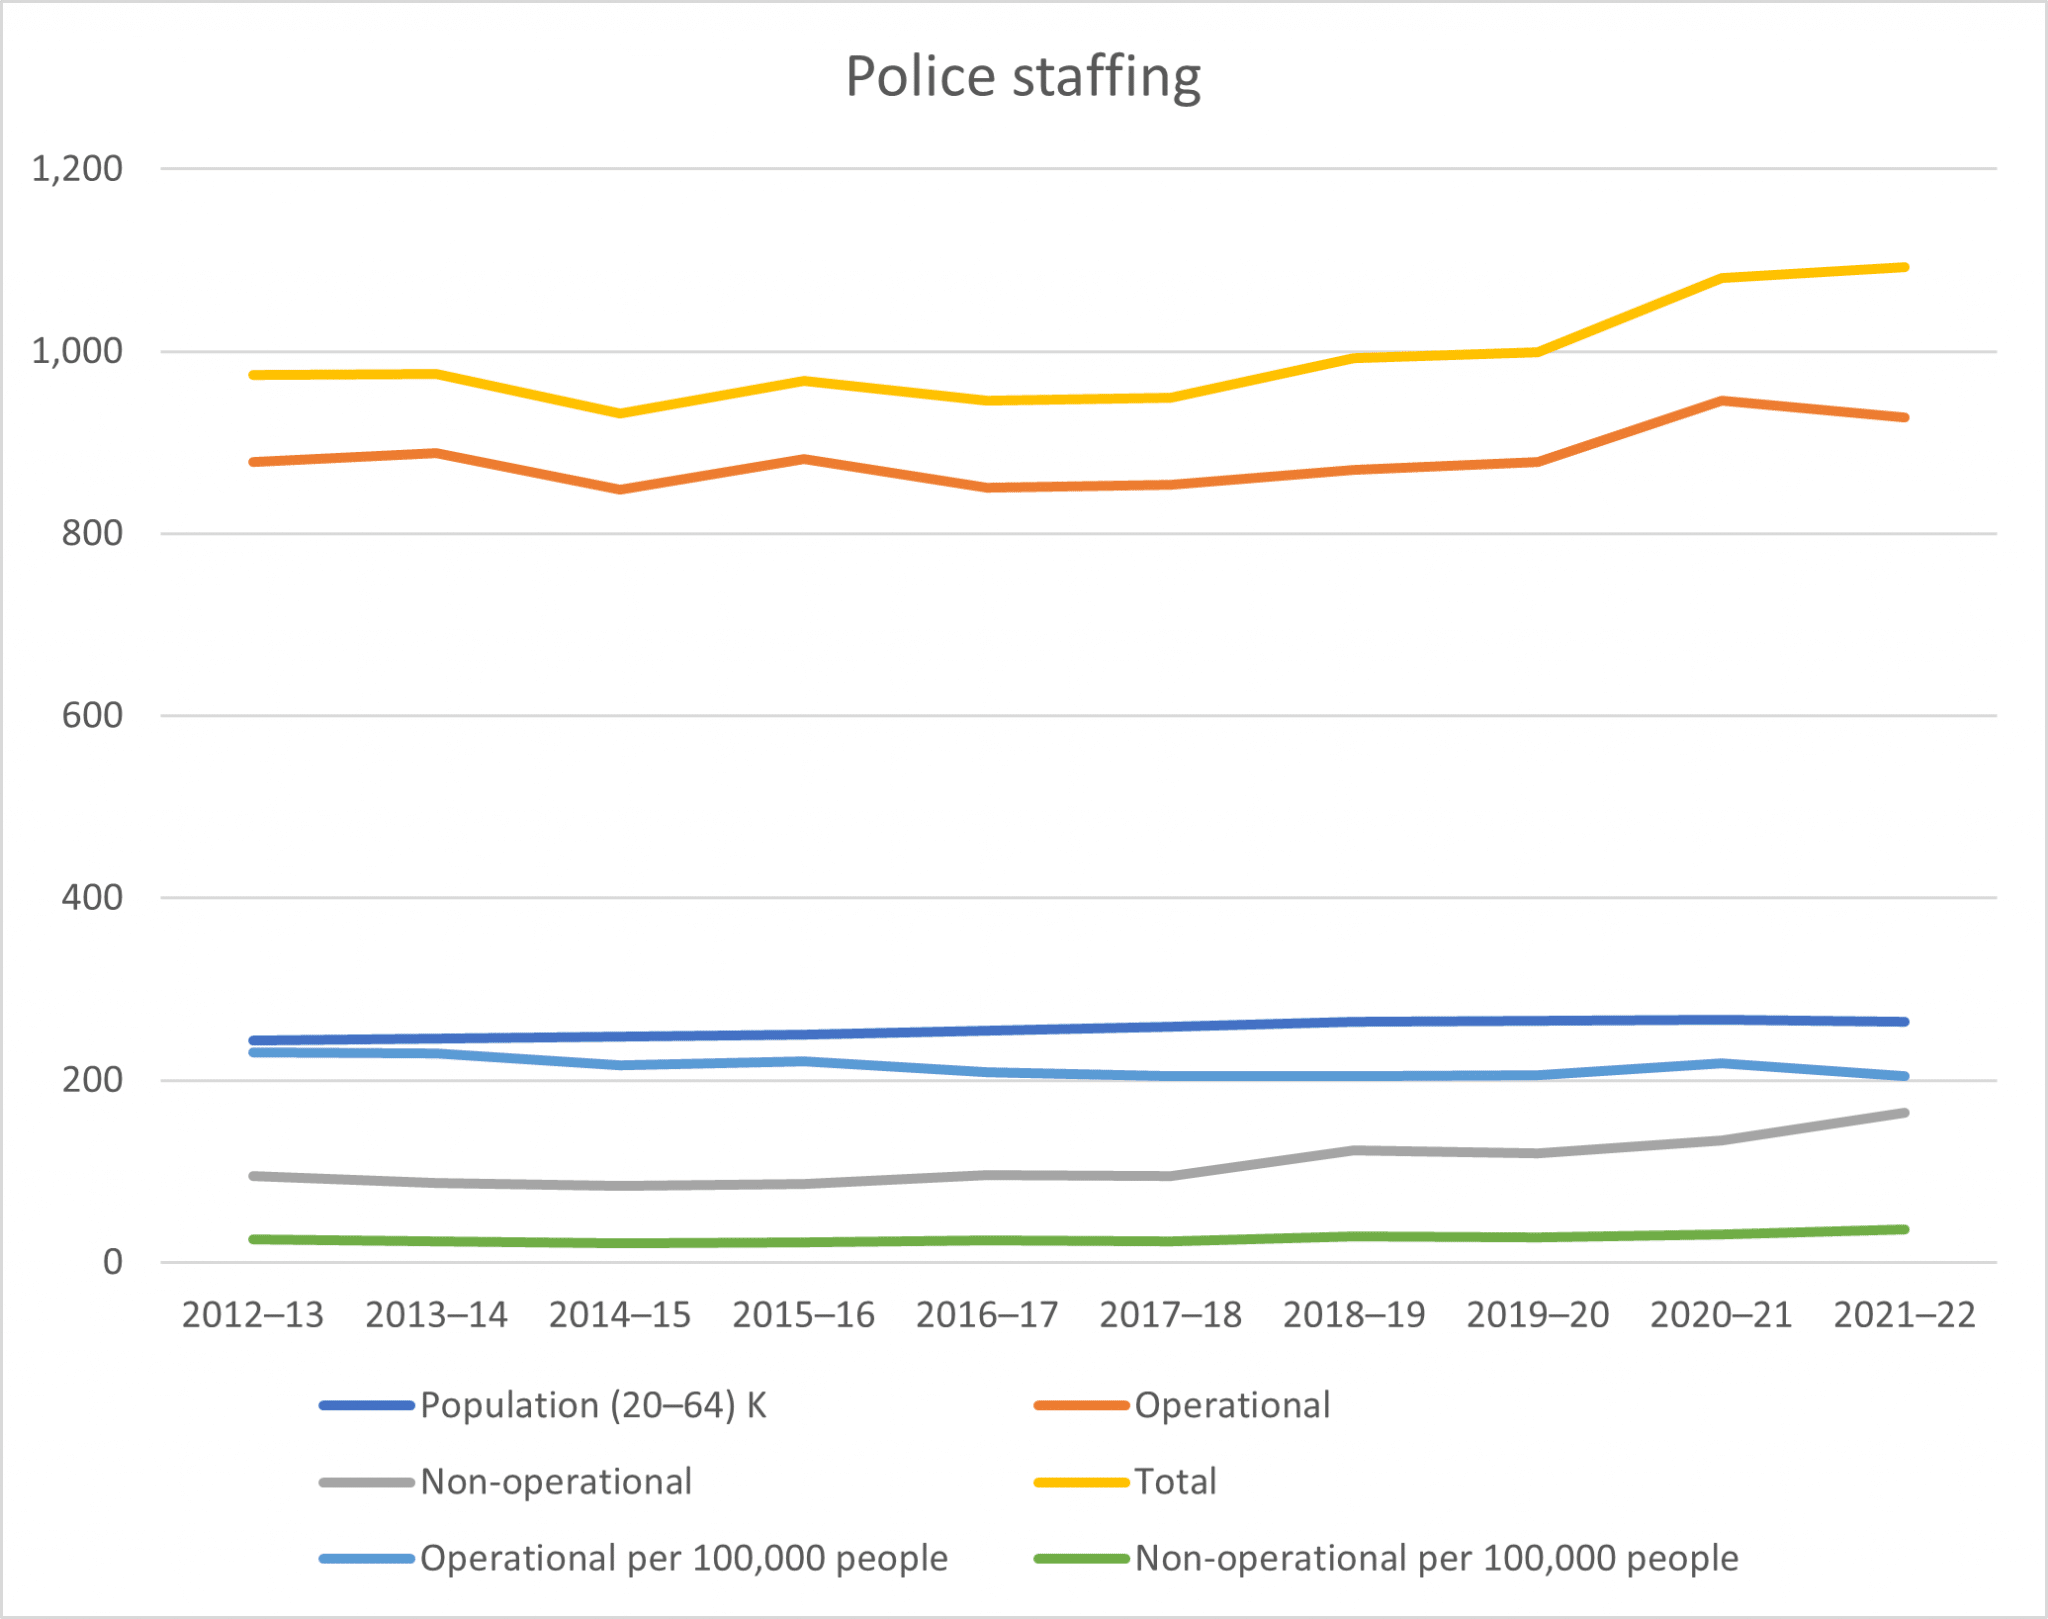
Police staffing
The ACT has 20,000 more people than it did a decade ago. The number of actual police has increased by 119 since 2012-13 (from 974 to 1,093). Operational numbers per 100,000, however, have fallen (from 231 in 2012-13 to 205 in 2021-22), and are the lowest in the nation for the 10th year in a row.
| Year | Population (20–64) | Operational | Non-operational | Total | Operational per 100,000 people | National | Non-operational per 100,000 people | National |
| 2012–13 | 243,100 (31/12/2012) | 879 | 95 | 974 | 231 (LOWEST) | 268 | 25 (6th) | 28 |
| 2013–14 | 245,800 (31/12/2013) | 888 | 87 | 975 | 230 (LOWEST) | 270 | 23 (5th) | 28 |
| 2014–15 | 247,700 (31/12/2016) | 848 | 84 | 932 | 216 (LOWEST) | 267 | 21 (6th) | 26 |
| 2015–16 | 250,500 (31/12/2015) | 882 | 86 | 968 | 221 (LOWEST) | 268 | 22 (6th) | 26 |
| 2016–17 | 254,500 (31/12/2016) | 850 | 96 | 946 | 209 (LOWEST) | 274 | 24 (5th) | 24 |
| 2017–18 | 259,300 (31/12/2017) | 854 | 95 | 949 | 205 (LOWEST) | 277 | 23 (5th) | 24 |
| 2018–19 | 263,700 (31/12/2018) | 870 | 123 | 993 | 205 (LOWEST) | 278 | 29 (4th) | 24 |
| 2019–20 | 264,800 (31/12/2019) | 879 | 120 | 999 | 206 (LOWEST) | 281 | 28 (4th) | 26 |
| 2020–21 | 266,000 (31/12/2020) | 946 | 134 | 1,081 | 219 (LOWEST) | 284 | 31 (4th) | 27 |
| 2021–22 | 264,600 (31/12/2021) | 928 | 164 | 1,093 | 205 (LOWEST) | 281 | 36 (5th) | 30 |
“The data again highlighted what the AFPA has been saying for a long time – ACT Policing needs more officers,” Australian Federal Police Association (AFPA) president Alex Caruana said.
In August, for instance, Mr Caruana said that because the ACT had the lowest number of police officers per 100,000 people in Australia, members were “fatigued and already stretched, which is influencing morale”.
Last February, the ACT Government rejected a motion by Canberra Liberals MLA Jeremy Hanson, shadow minister for police, to increase the number of police to match per-capita levels with NSW, and to adequately resource ACT Policing to re-establish face-to-face crime reporting and investigation. (In 2021, ACT Policing introduced an online reporting system for property crimes – due, Mr Hanson said at the time, to a shortage of police.)
- Liberals say Molonglo Valley needs a police station (30 August 2022)
- No bill for the Old Bill: Liberal motion comes a-copper (10 February 2022)
- ACT Policing to expand online reporting for property crimes (1 December 2021)
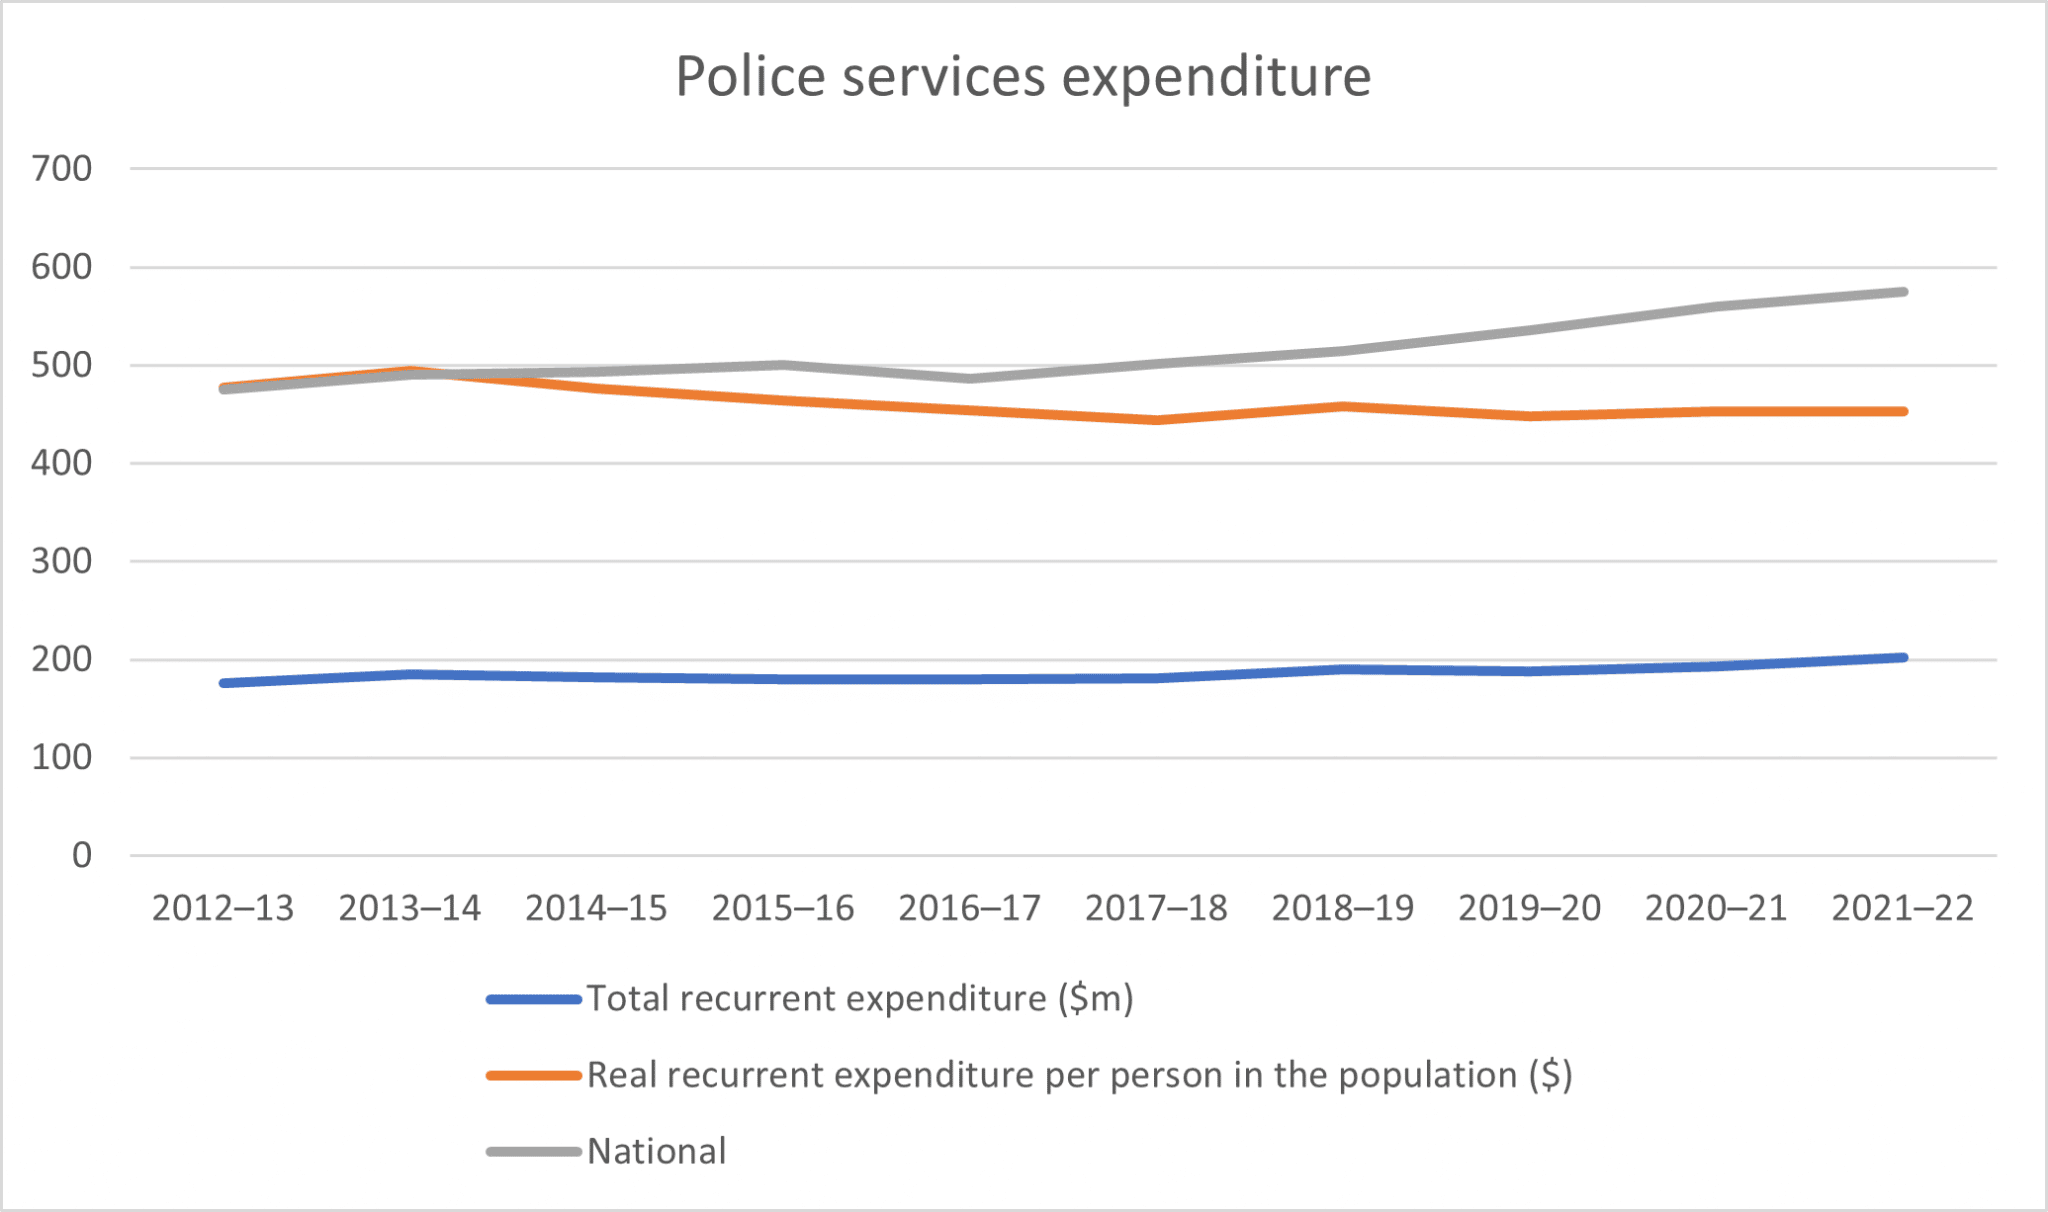
Police services expenditure
The ACT Government’s recurrent expenditure on police services was $26.9 million more in 2021–22 ($202.4 million) than in 2012–13 ($175.5 million) – but real recurrent expenditure per person fell by $24.90 per person (from $477.57 in 2012-13 to $452.67 in 2021-22). It is more than $120 below the national average, and is the lowest in the Australia for the fourth year running.
| Year | Total recurrent expenditure ($m) | Real recurrent expenditure per person in the population ($) | National |
| 2012–13 | 175.5 | 477.57 | 474.78 |
| 2013–14 | 185.2 | 494.54 | 489.97 |
| 2014–15 | 181.8 | 476.34 | 492.88 |
| 2015–16 | 180.4 | 463.68 | 500.60 |
| 2016–17 | 179.7 | 453.72 | 485.86 |
| 2017–18 | 181.2 | 443.96 | 501.36 |
| 2018–19 | 190.3 | 457.75 (LOWEST) | 514.72 |
| 2019–20 | 188.2 | 448.08 (LOWEST) | 536.17 |
| 2020–21 | 192.6 | 453.52 (LOWEST) | 559.98 |
| 2021–22 | 202.4 | 452.67 (LOWEST) | 574.57 |
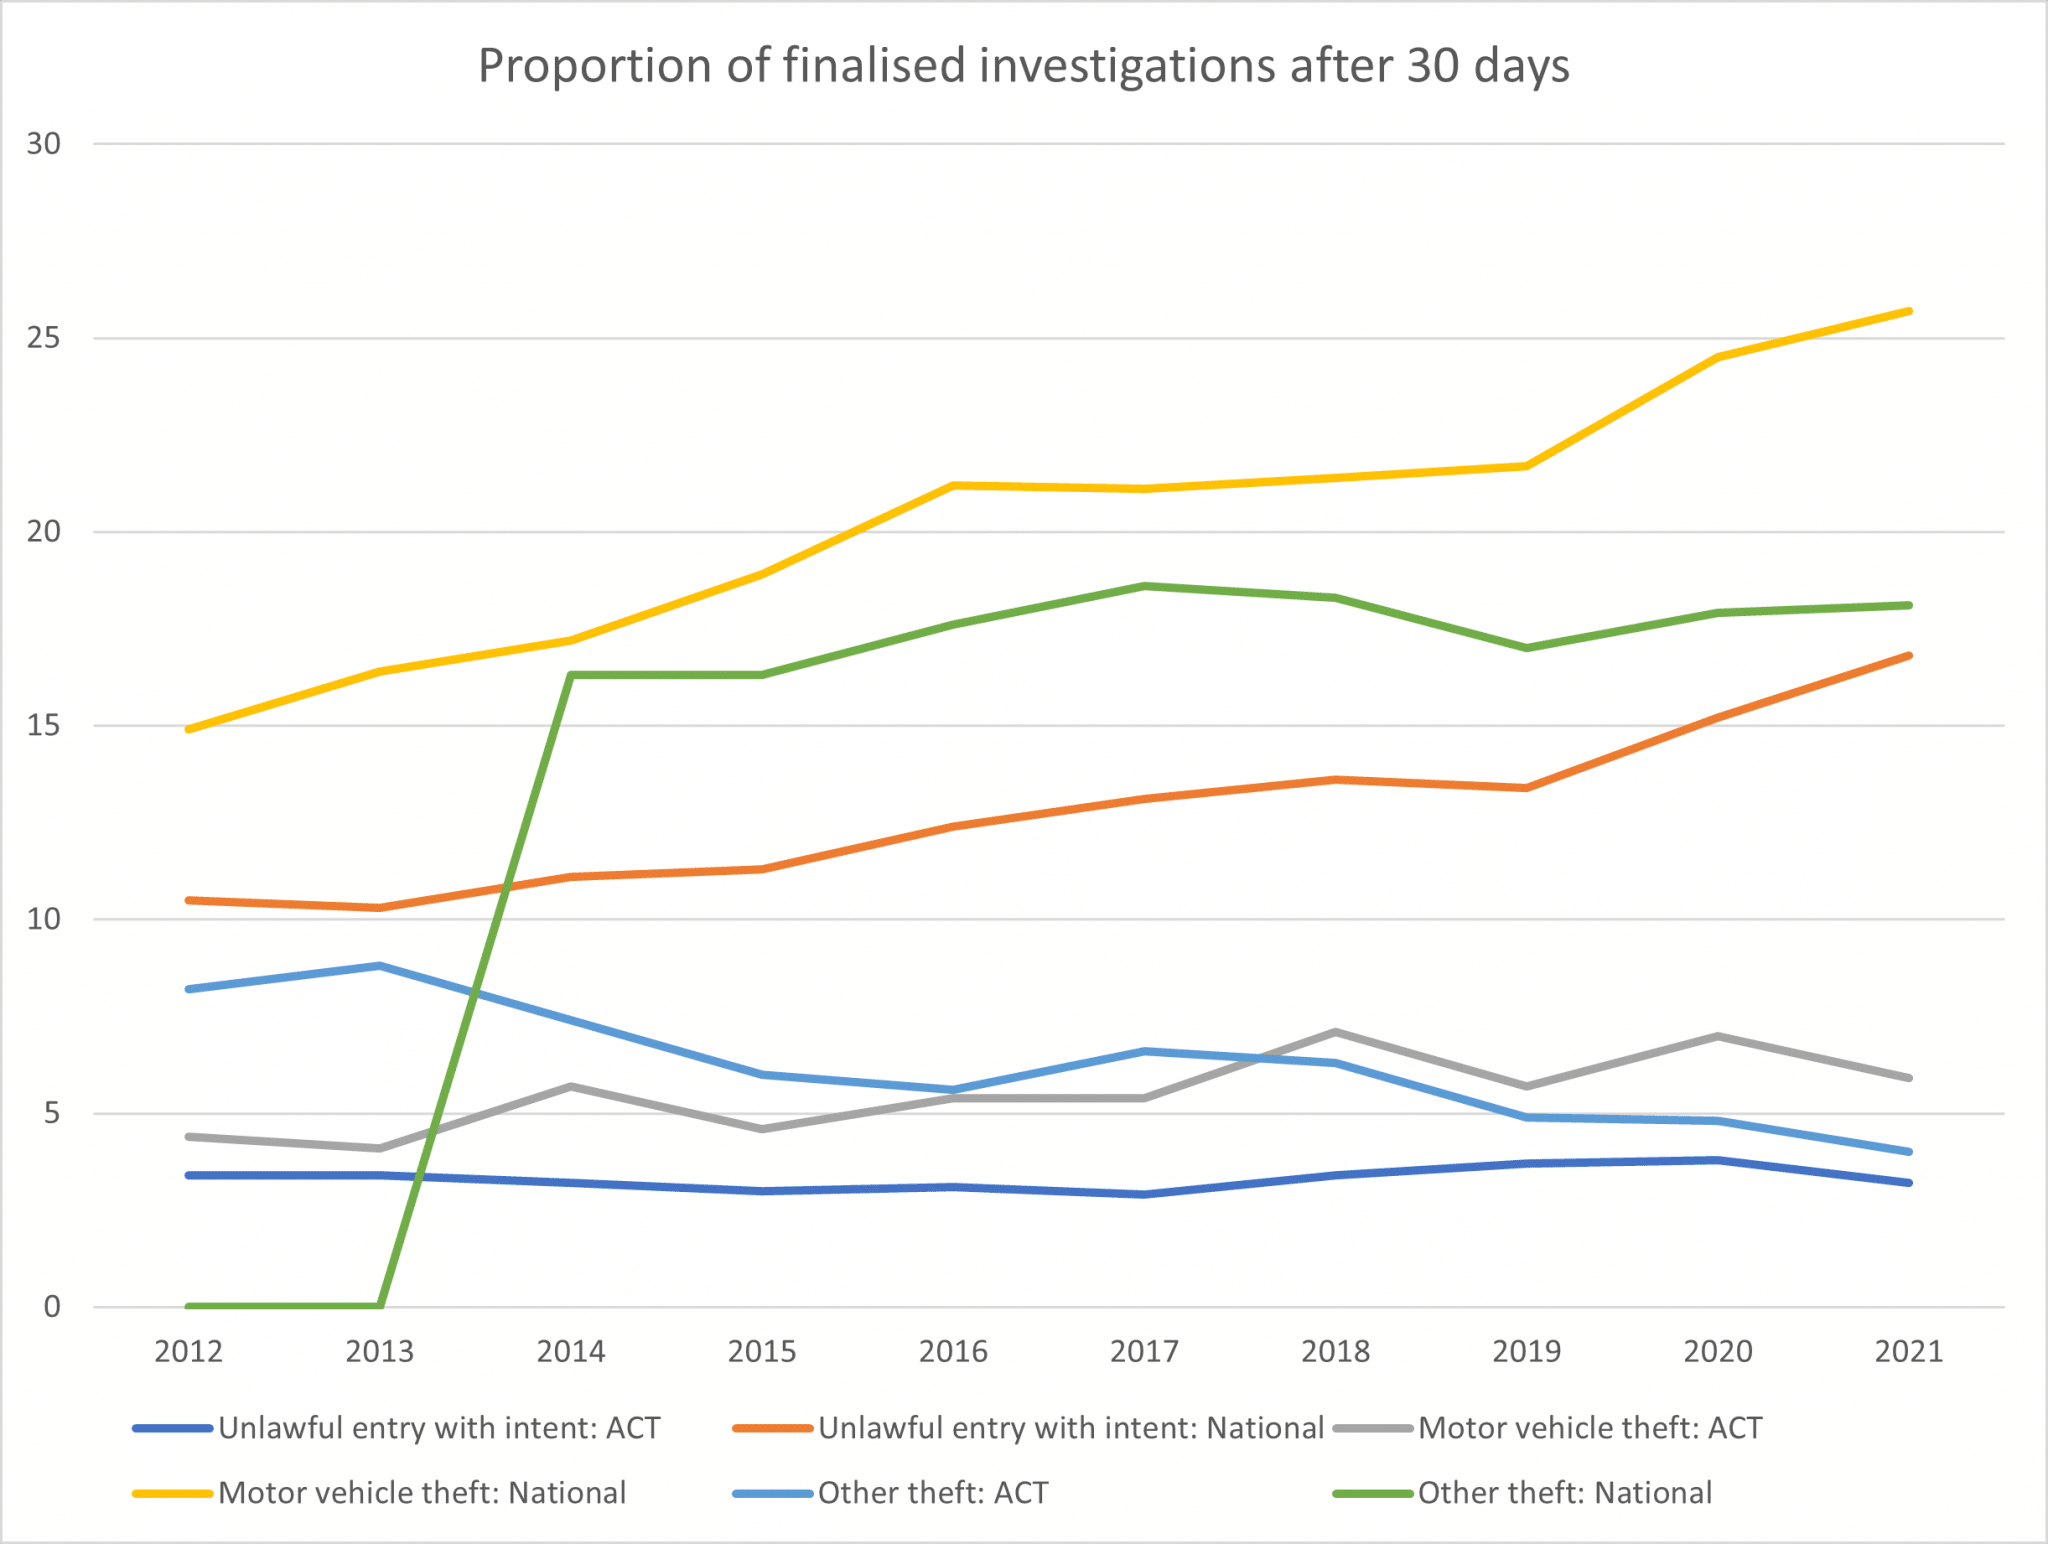
Crime clearance
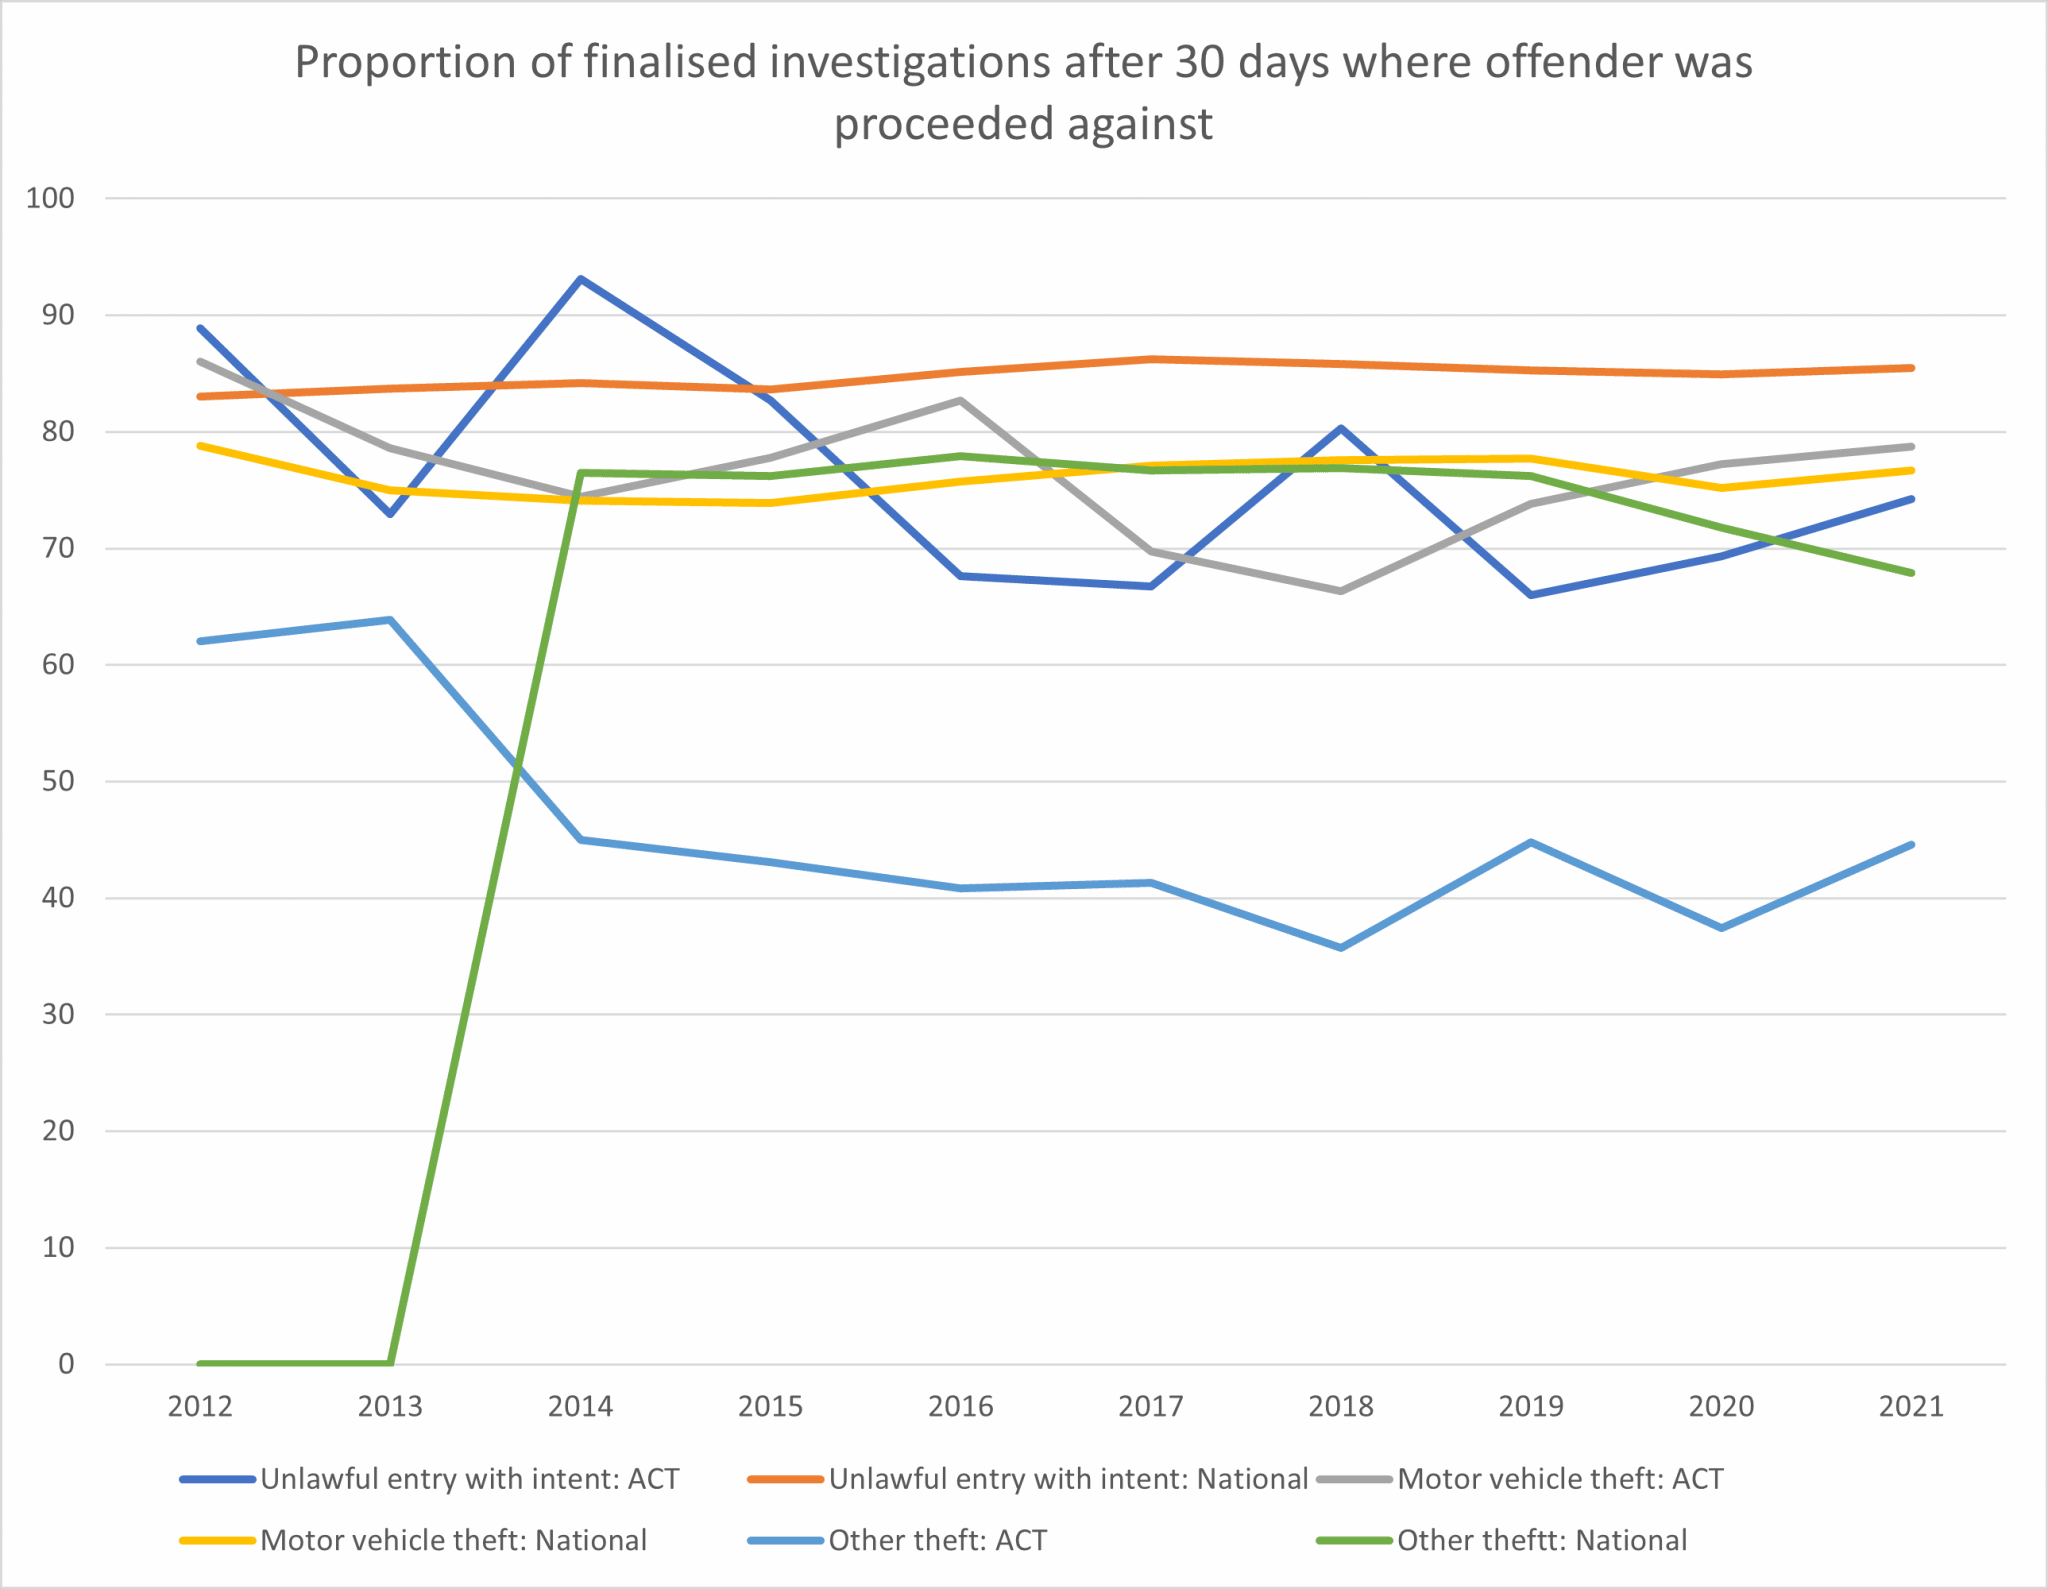
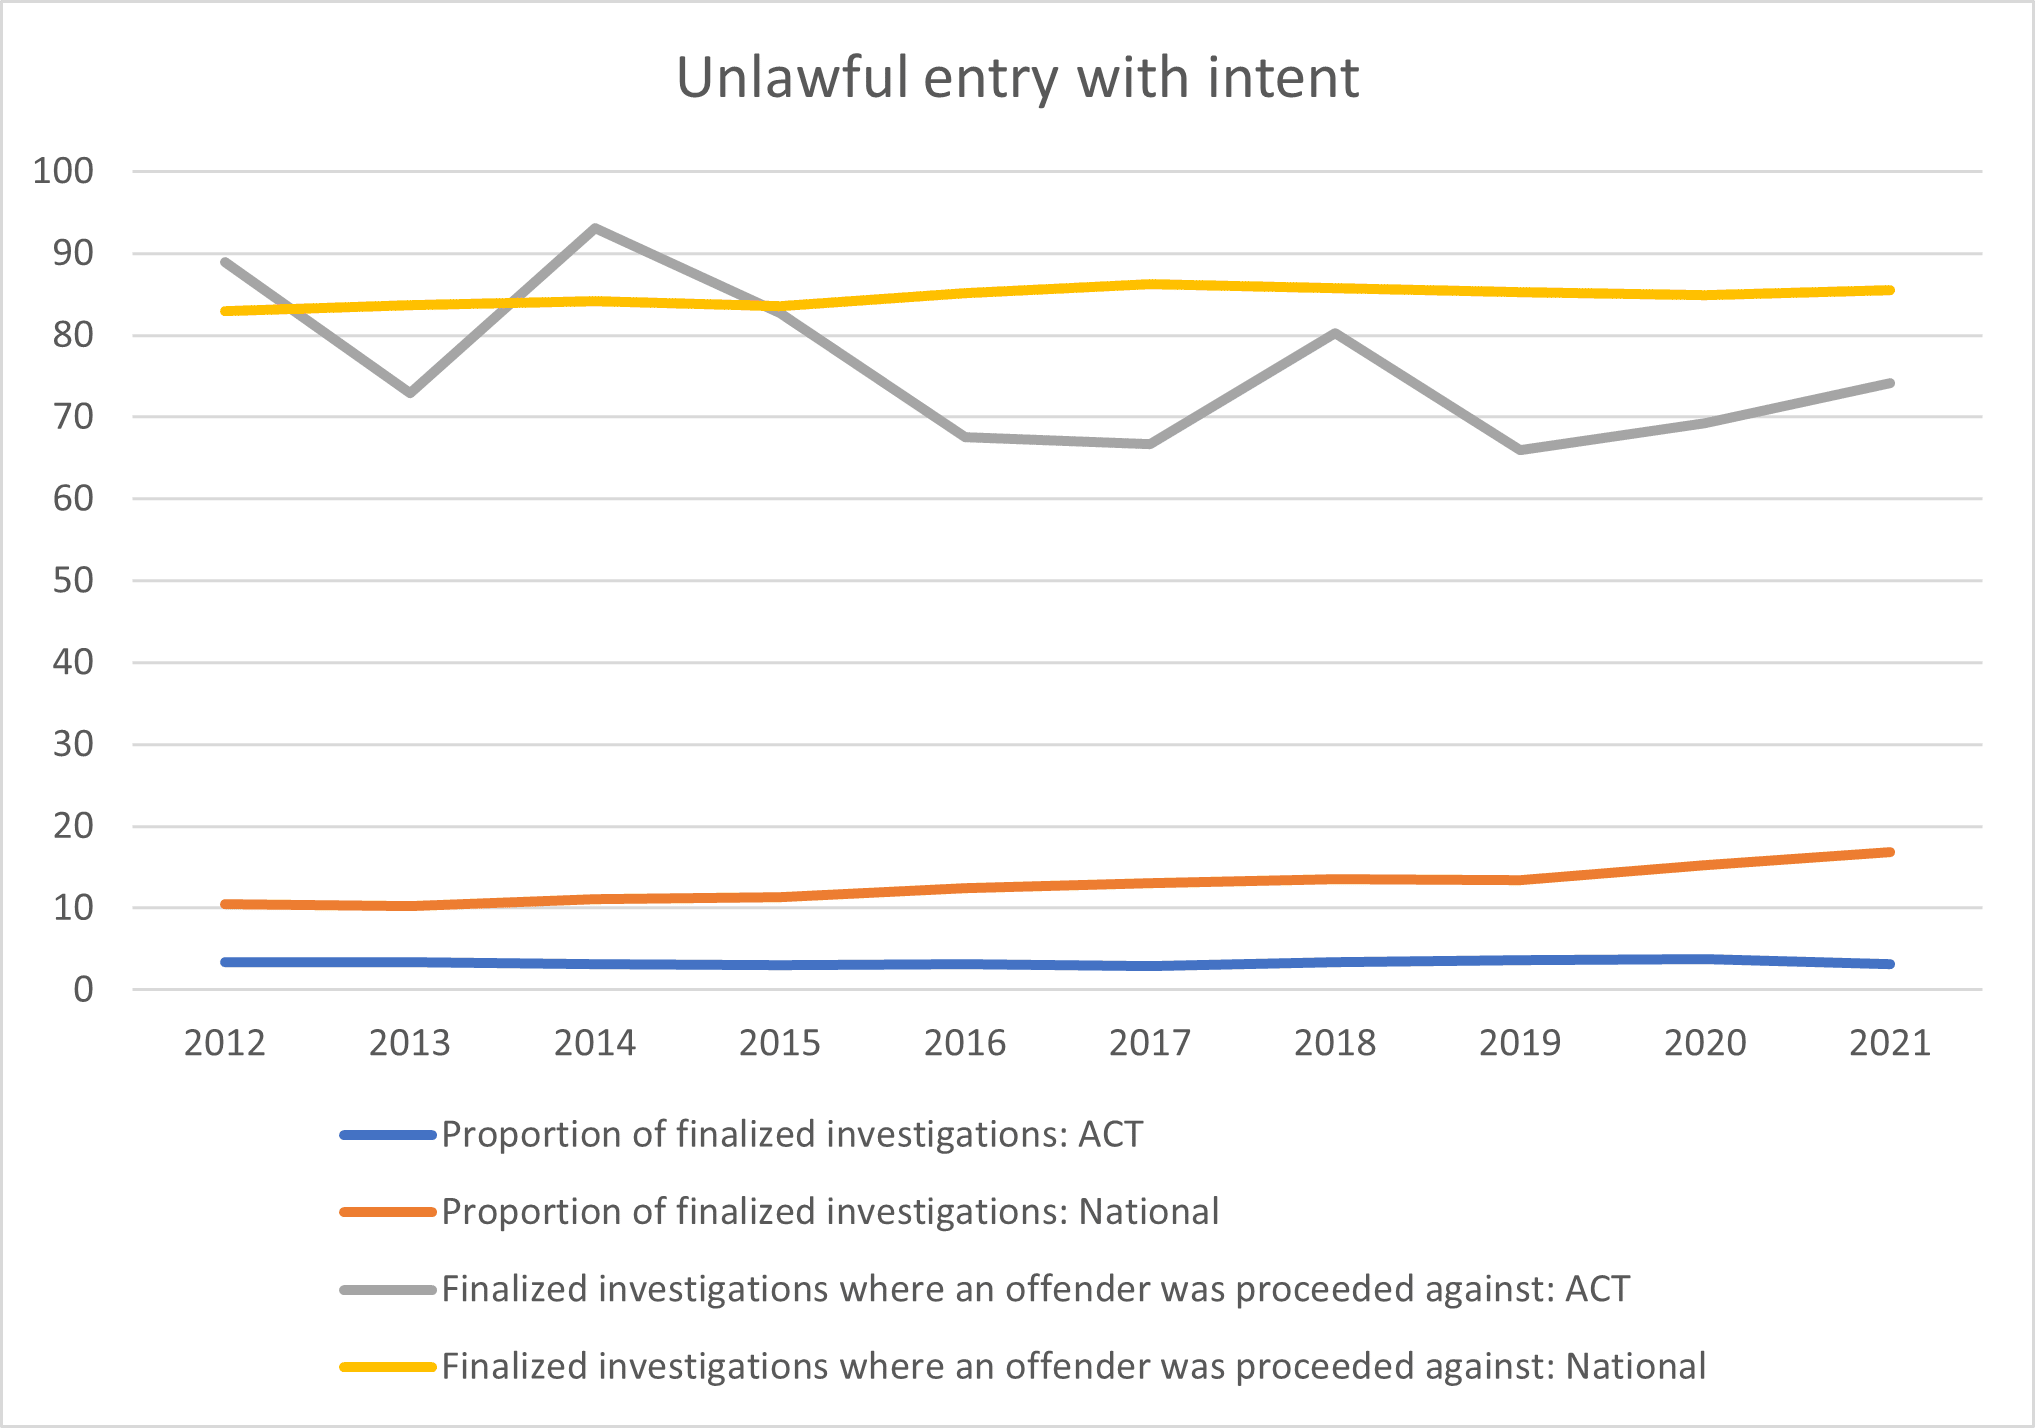
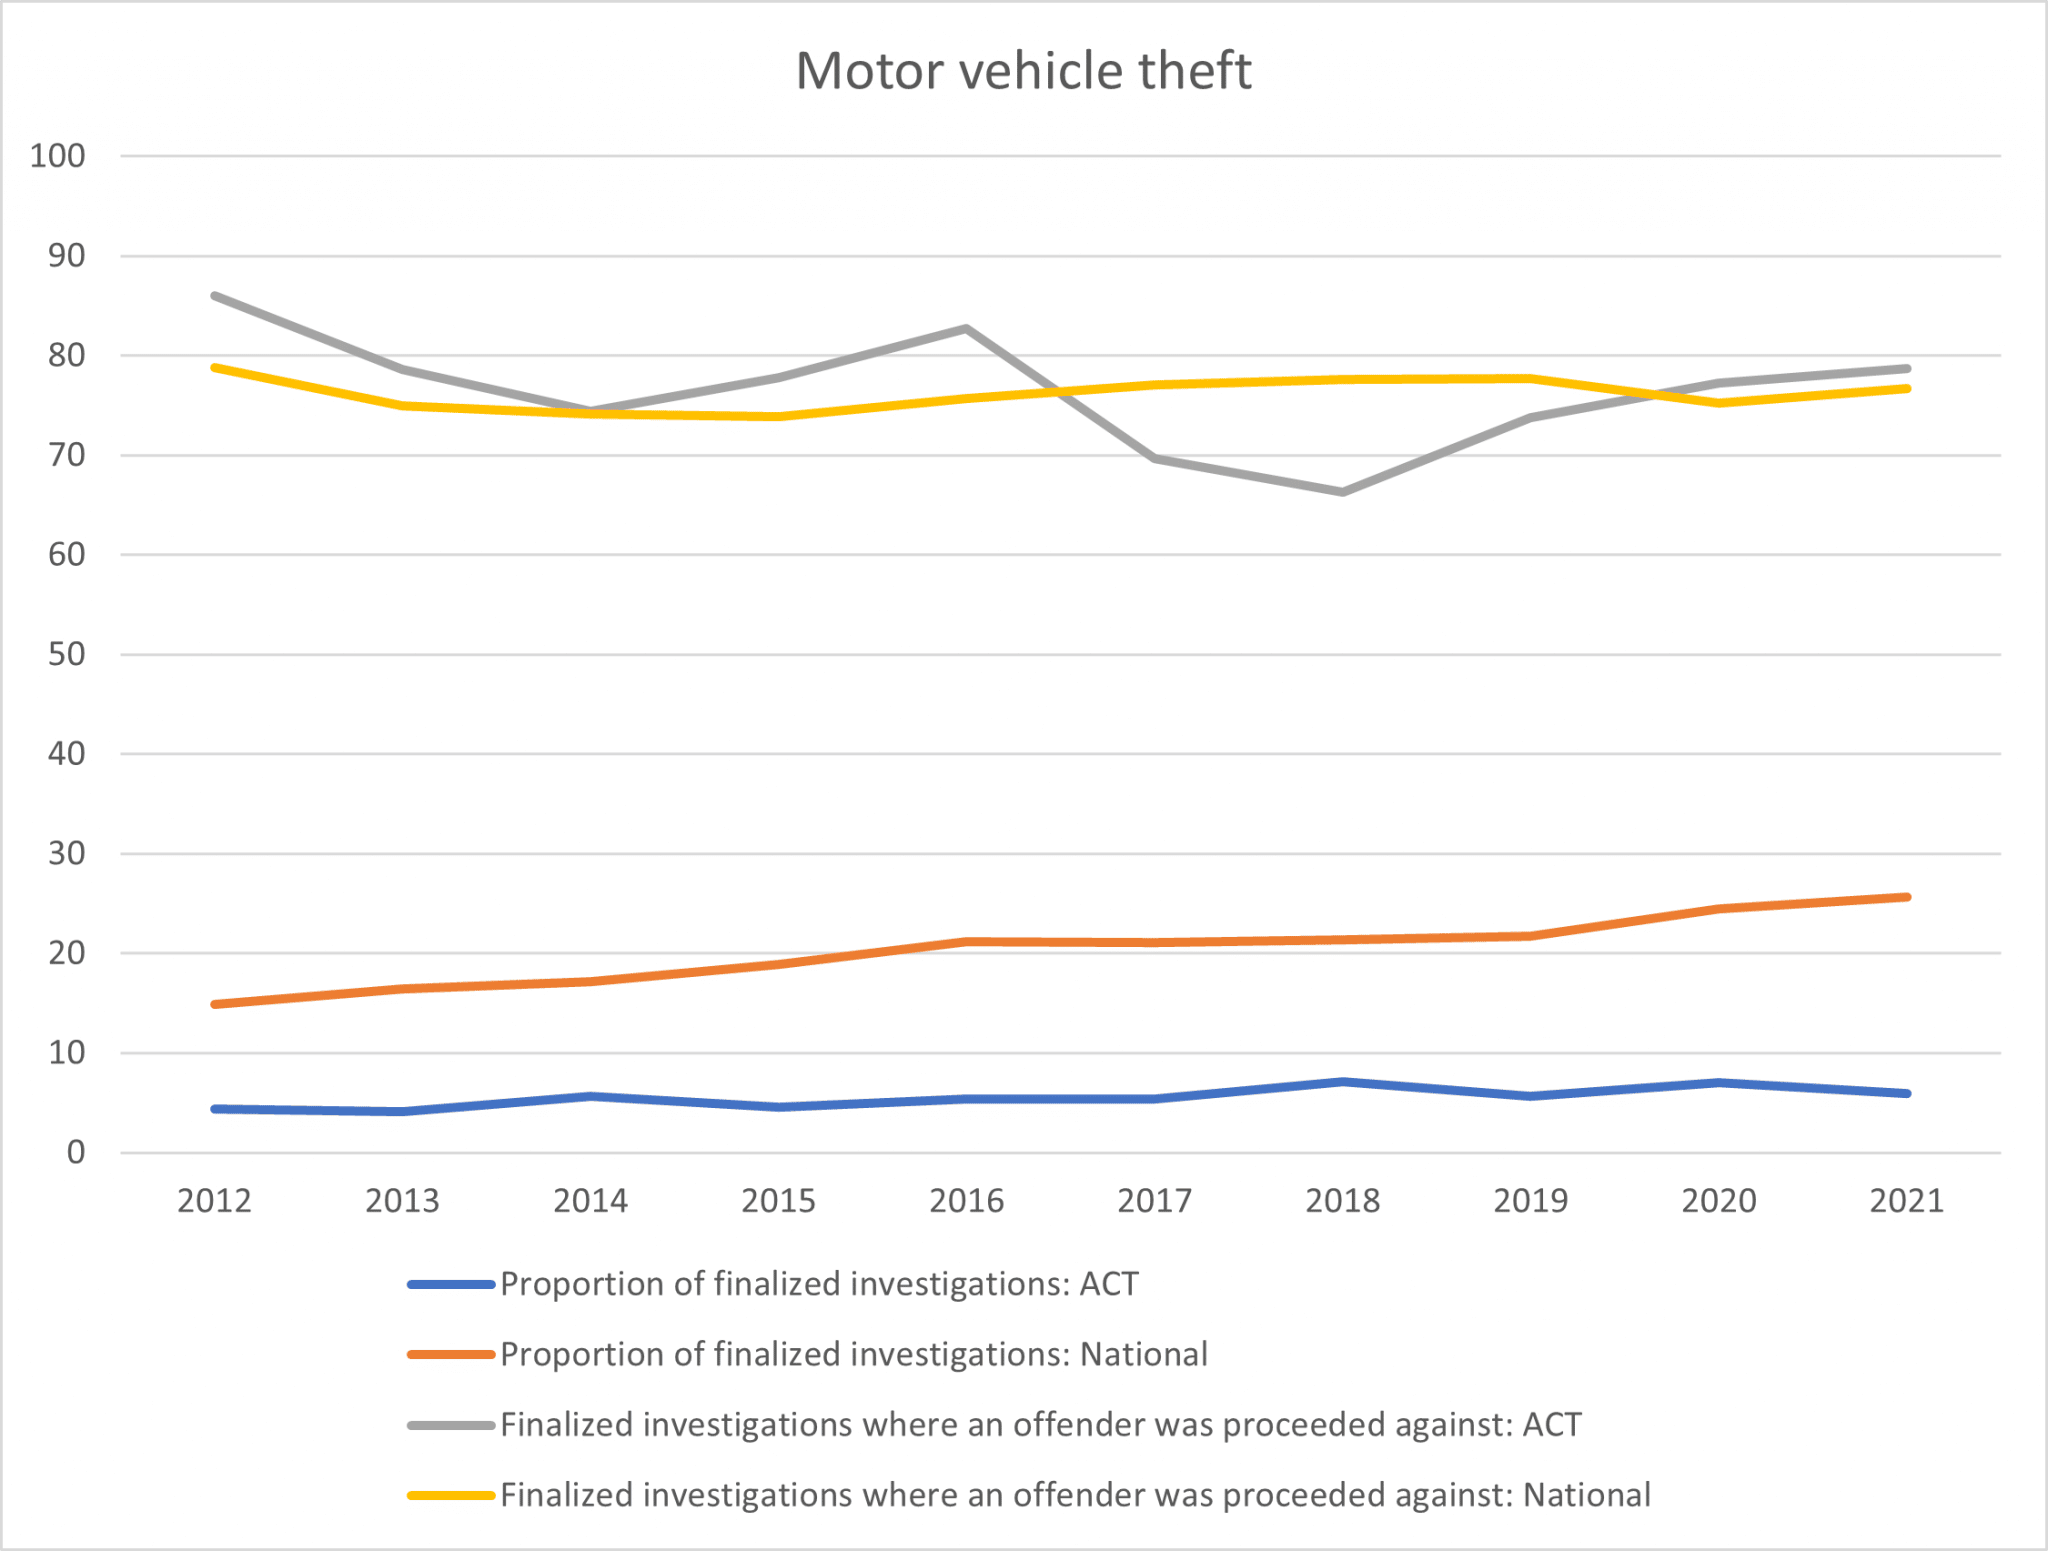
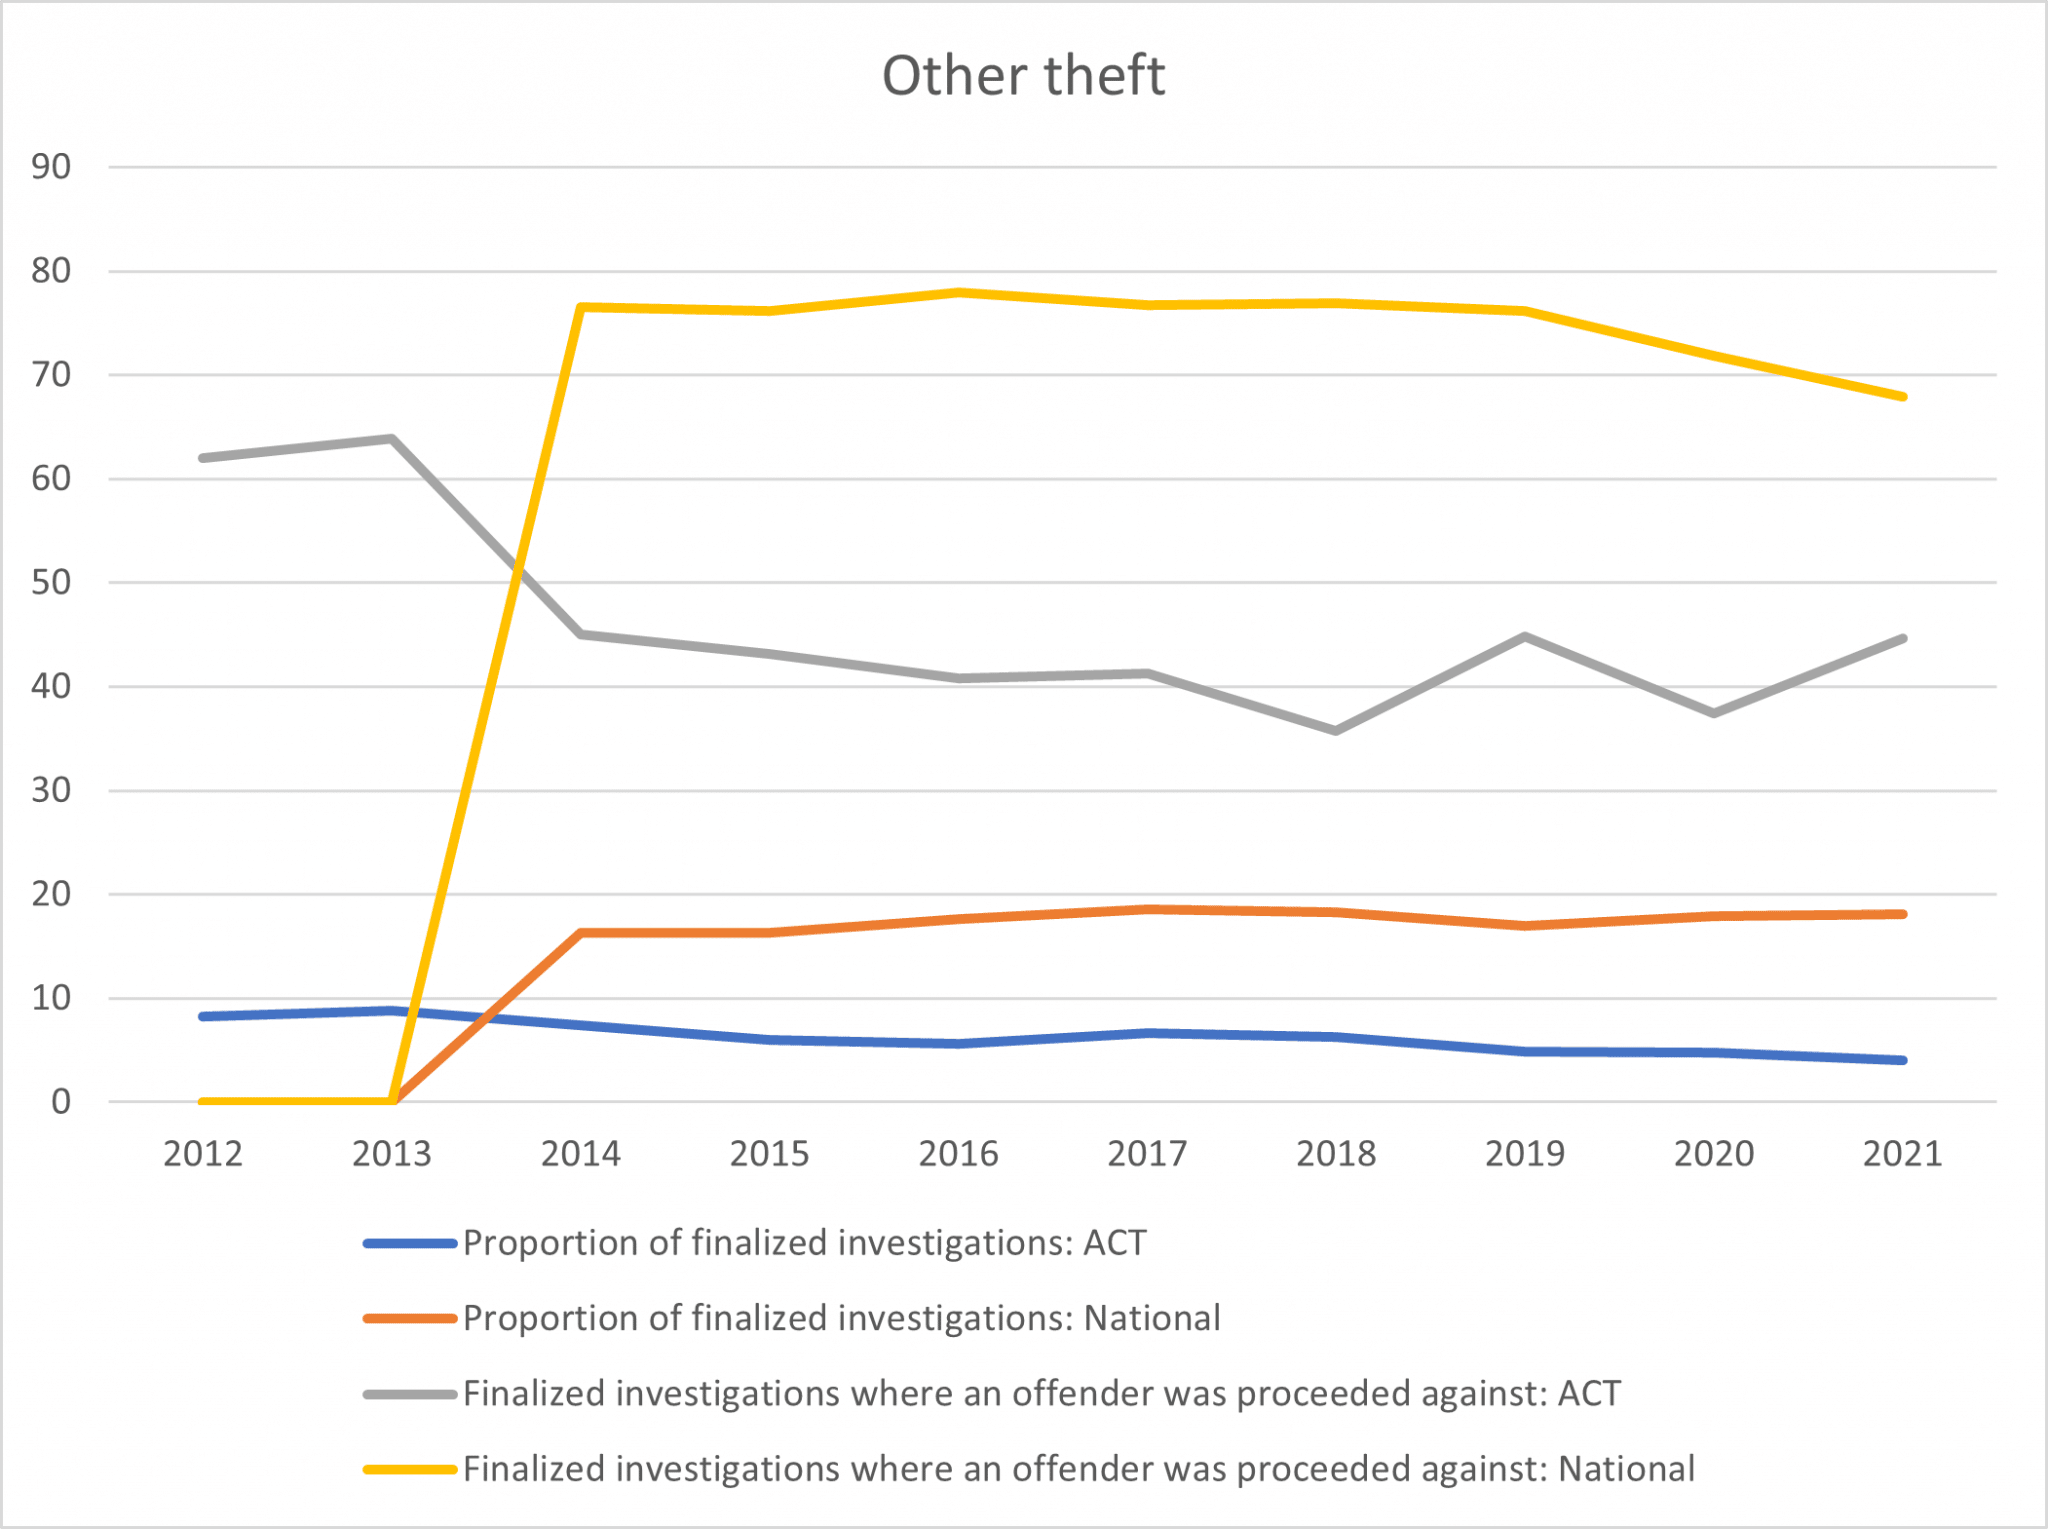
The ACT has the consistently lowest rate for clearance of property offences, for the 10th year in a row.
| Unlawful entry with intent | Motor vehicle theft | Other theft | ||||||||||
| Year | Proportion of finalised investigations | National | Finalised investigations where an offender was proceeded against | National | Proportion of finalised investigations | National | Finalised investigations where an offender was proceeded against | National | Proportion of finalised investigations | National | Finalised investigations where an offender was proceeded against | National |
| 2012 | 3.4 (LOWEST) | 10.5 | 88.9 | 83.0 | 4.4 (LOWEST) | 14.9 | 86.0 | 78.8 | 8.2 (LOWEST) | Np | 62.0 | Np |
| 2013 | 3.4 (LOWEST) | 10.3 | 72.9 | 83.7 | 4.1 (LOWEST) | 16.4 | 78.6 | 75.0 | 8.8 (LOWEST) | Np | 63.9 | Np |
| 2014 | 3.2 (LOWEST) | 11.1 | 93.1 | 84.2 | 5.7 (LOWEST) | 17.2 | 74.4 | 74.1 | 7.4 (LOWEST) | 16.3 | 45.0 | 76.5 |
| 2015 | 3.0 (LOWEST) | 11.3 | 82.7 | 83.6 | 4.6 (LOWEST) | 18.9 | 77.8 | 73.9 | 6.0 (LOWEST) | 16.3 | 43.1 | 76.2 |
| 2016 | 3.1 (LOWEST) | 12.4 | 67.6 (LOWEST) | 85.1 | 5.4 (LOWEST) | 21.2 | 82.7 | 75.7 | 5.6 (LOWEST) | 17.6 | 40.8 | 77.9 |
| 2017 | 2.9 (LOWEST) | 13.1 | 66.7 (LOWEST) | 86.2 | 5.4 (LOWEST) | 21.1 | 69.7 | 77.1 | 6.6 (LOWEST) | 18.6 | 41.3 | 76.7 |
| 2018 | 3.4 (LOWEST) | 13.6 | 80.3 | 85.8 | 7.1 (LOWEST) | 21.4 | 66.3 | 77.6 | 6.3 (LOWEST) | 18.3 | 35.7 | 76.9 |
| 2019 | 3.7 (LOWEST) | 13.4 | 66.0 | 85.3 | 5.7 (LOWEST) | 21.7 | 73.8 | 77.7 | 4.9 (LOWEST) | 17.0 | 44.8 | 76.2 |
| 2020 | 3.8 (LOWEST) | 15.2 | 69.3 | 84.9 | 7.0 (LOWEST) | 24.5 | 77.2 | 75.2 | 4.8 (LOWEST) | 17.9 | 37.4 | 71.8 |
| 2021 | 3.2 (LOWEST) | 16.8 | 74.2 | 85.5 | 5.9 (LOWEST) | 25.7 | 78.7 | 76.7 | 4.0 (LOWEST) | 18.1 | 44.6 | 67.9 |
Outcome of investigation at 30 days, selected property offences
Crime rates
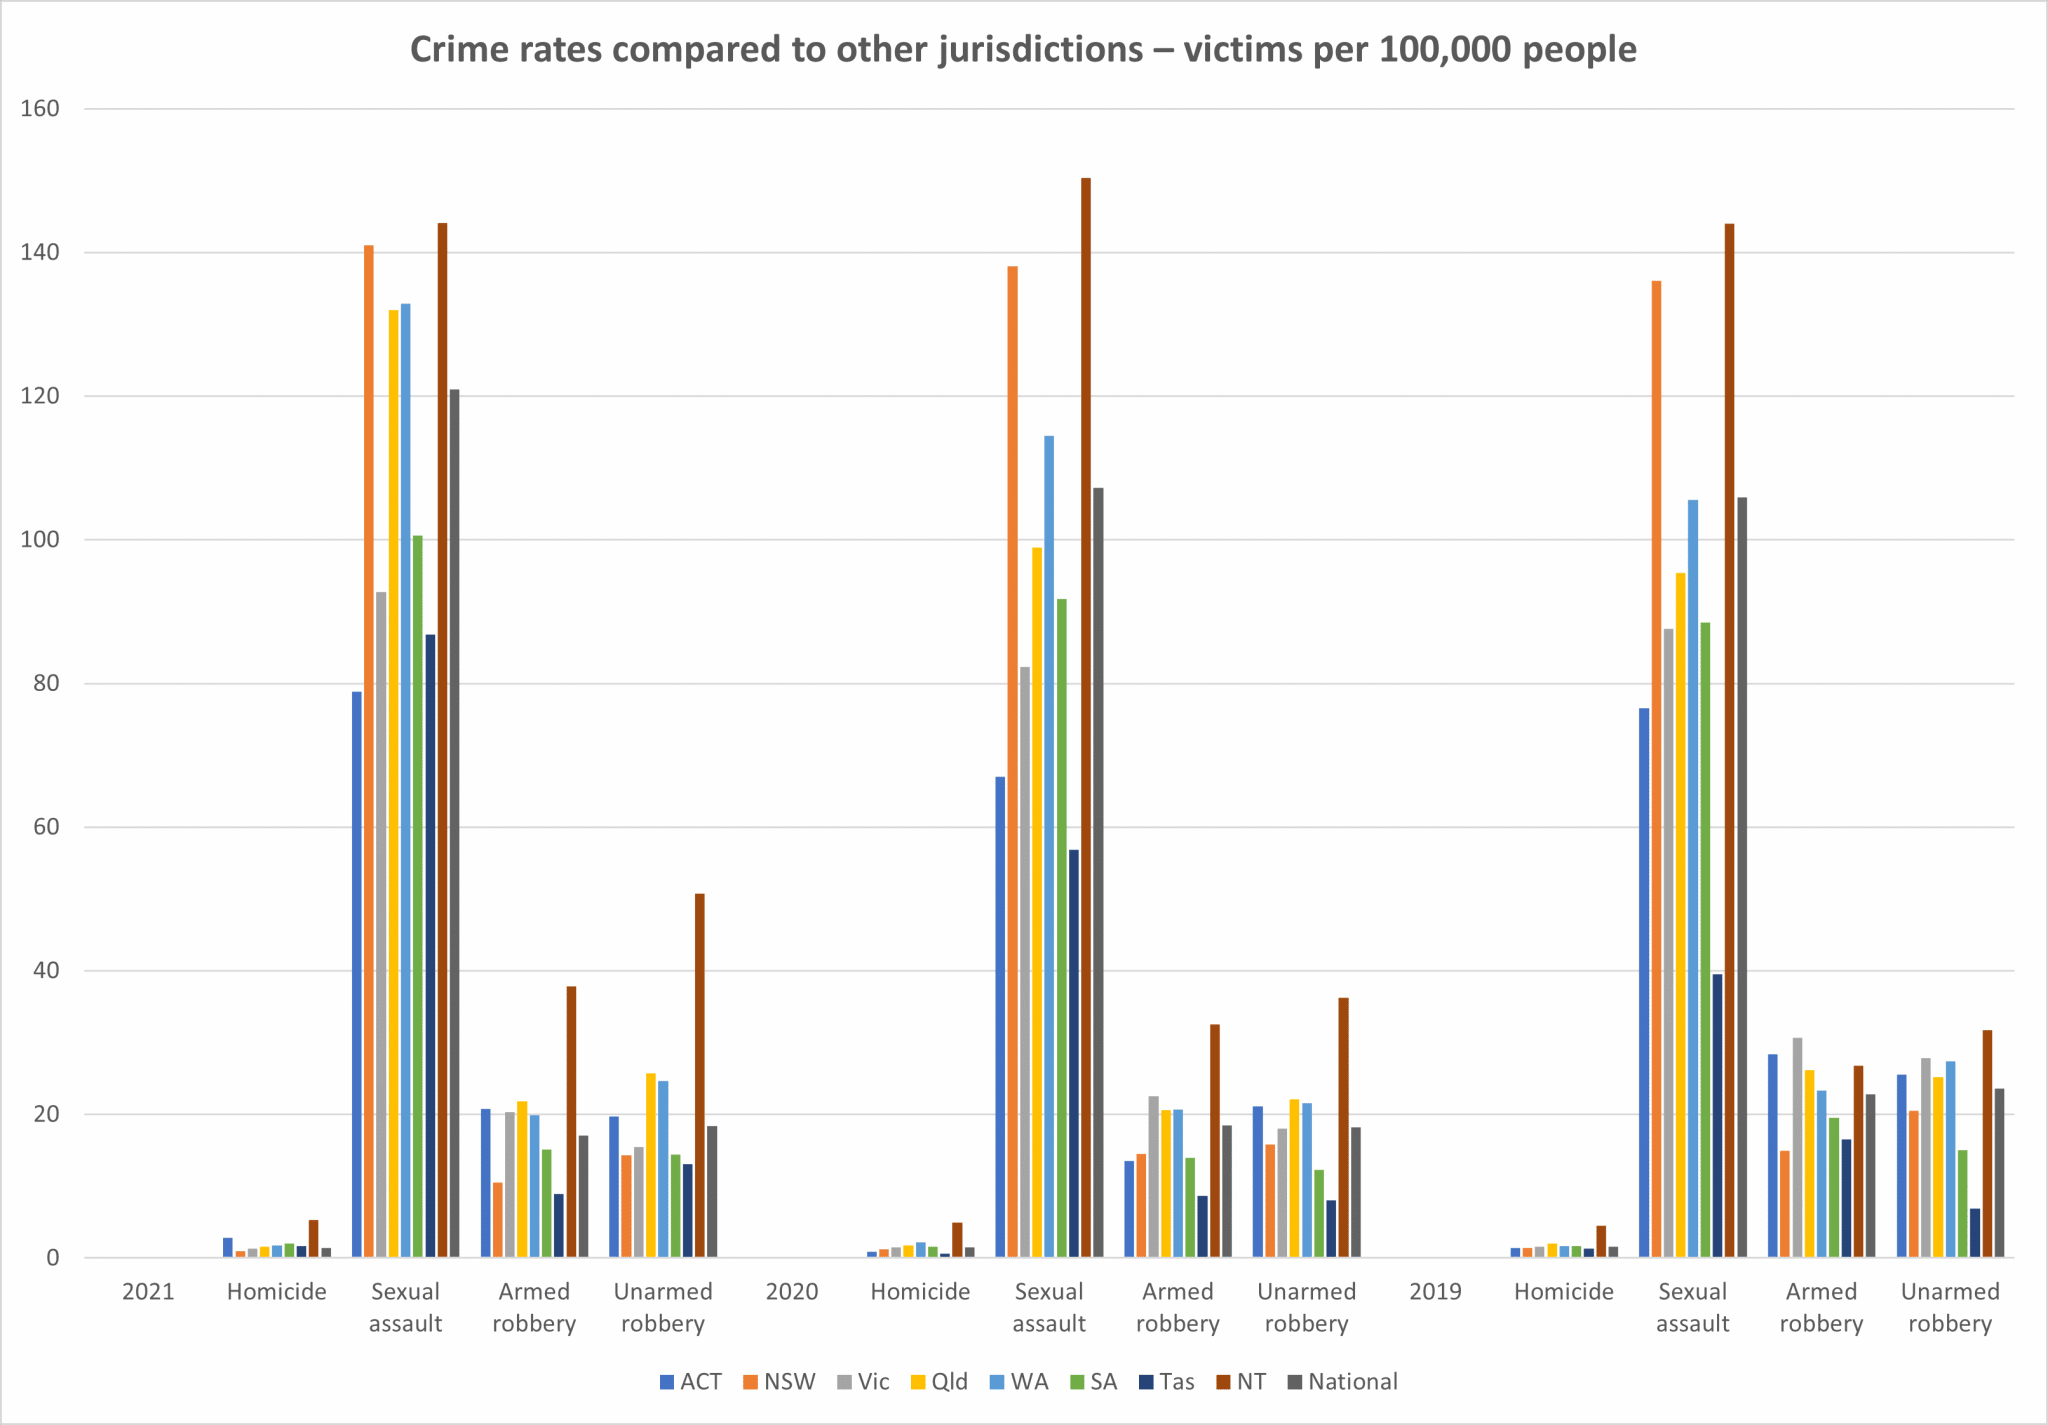
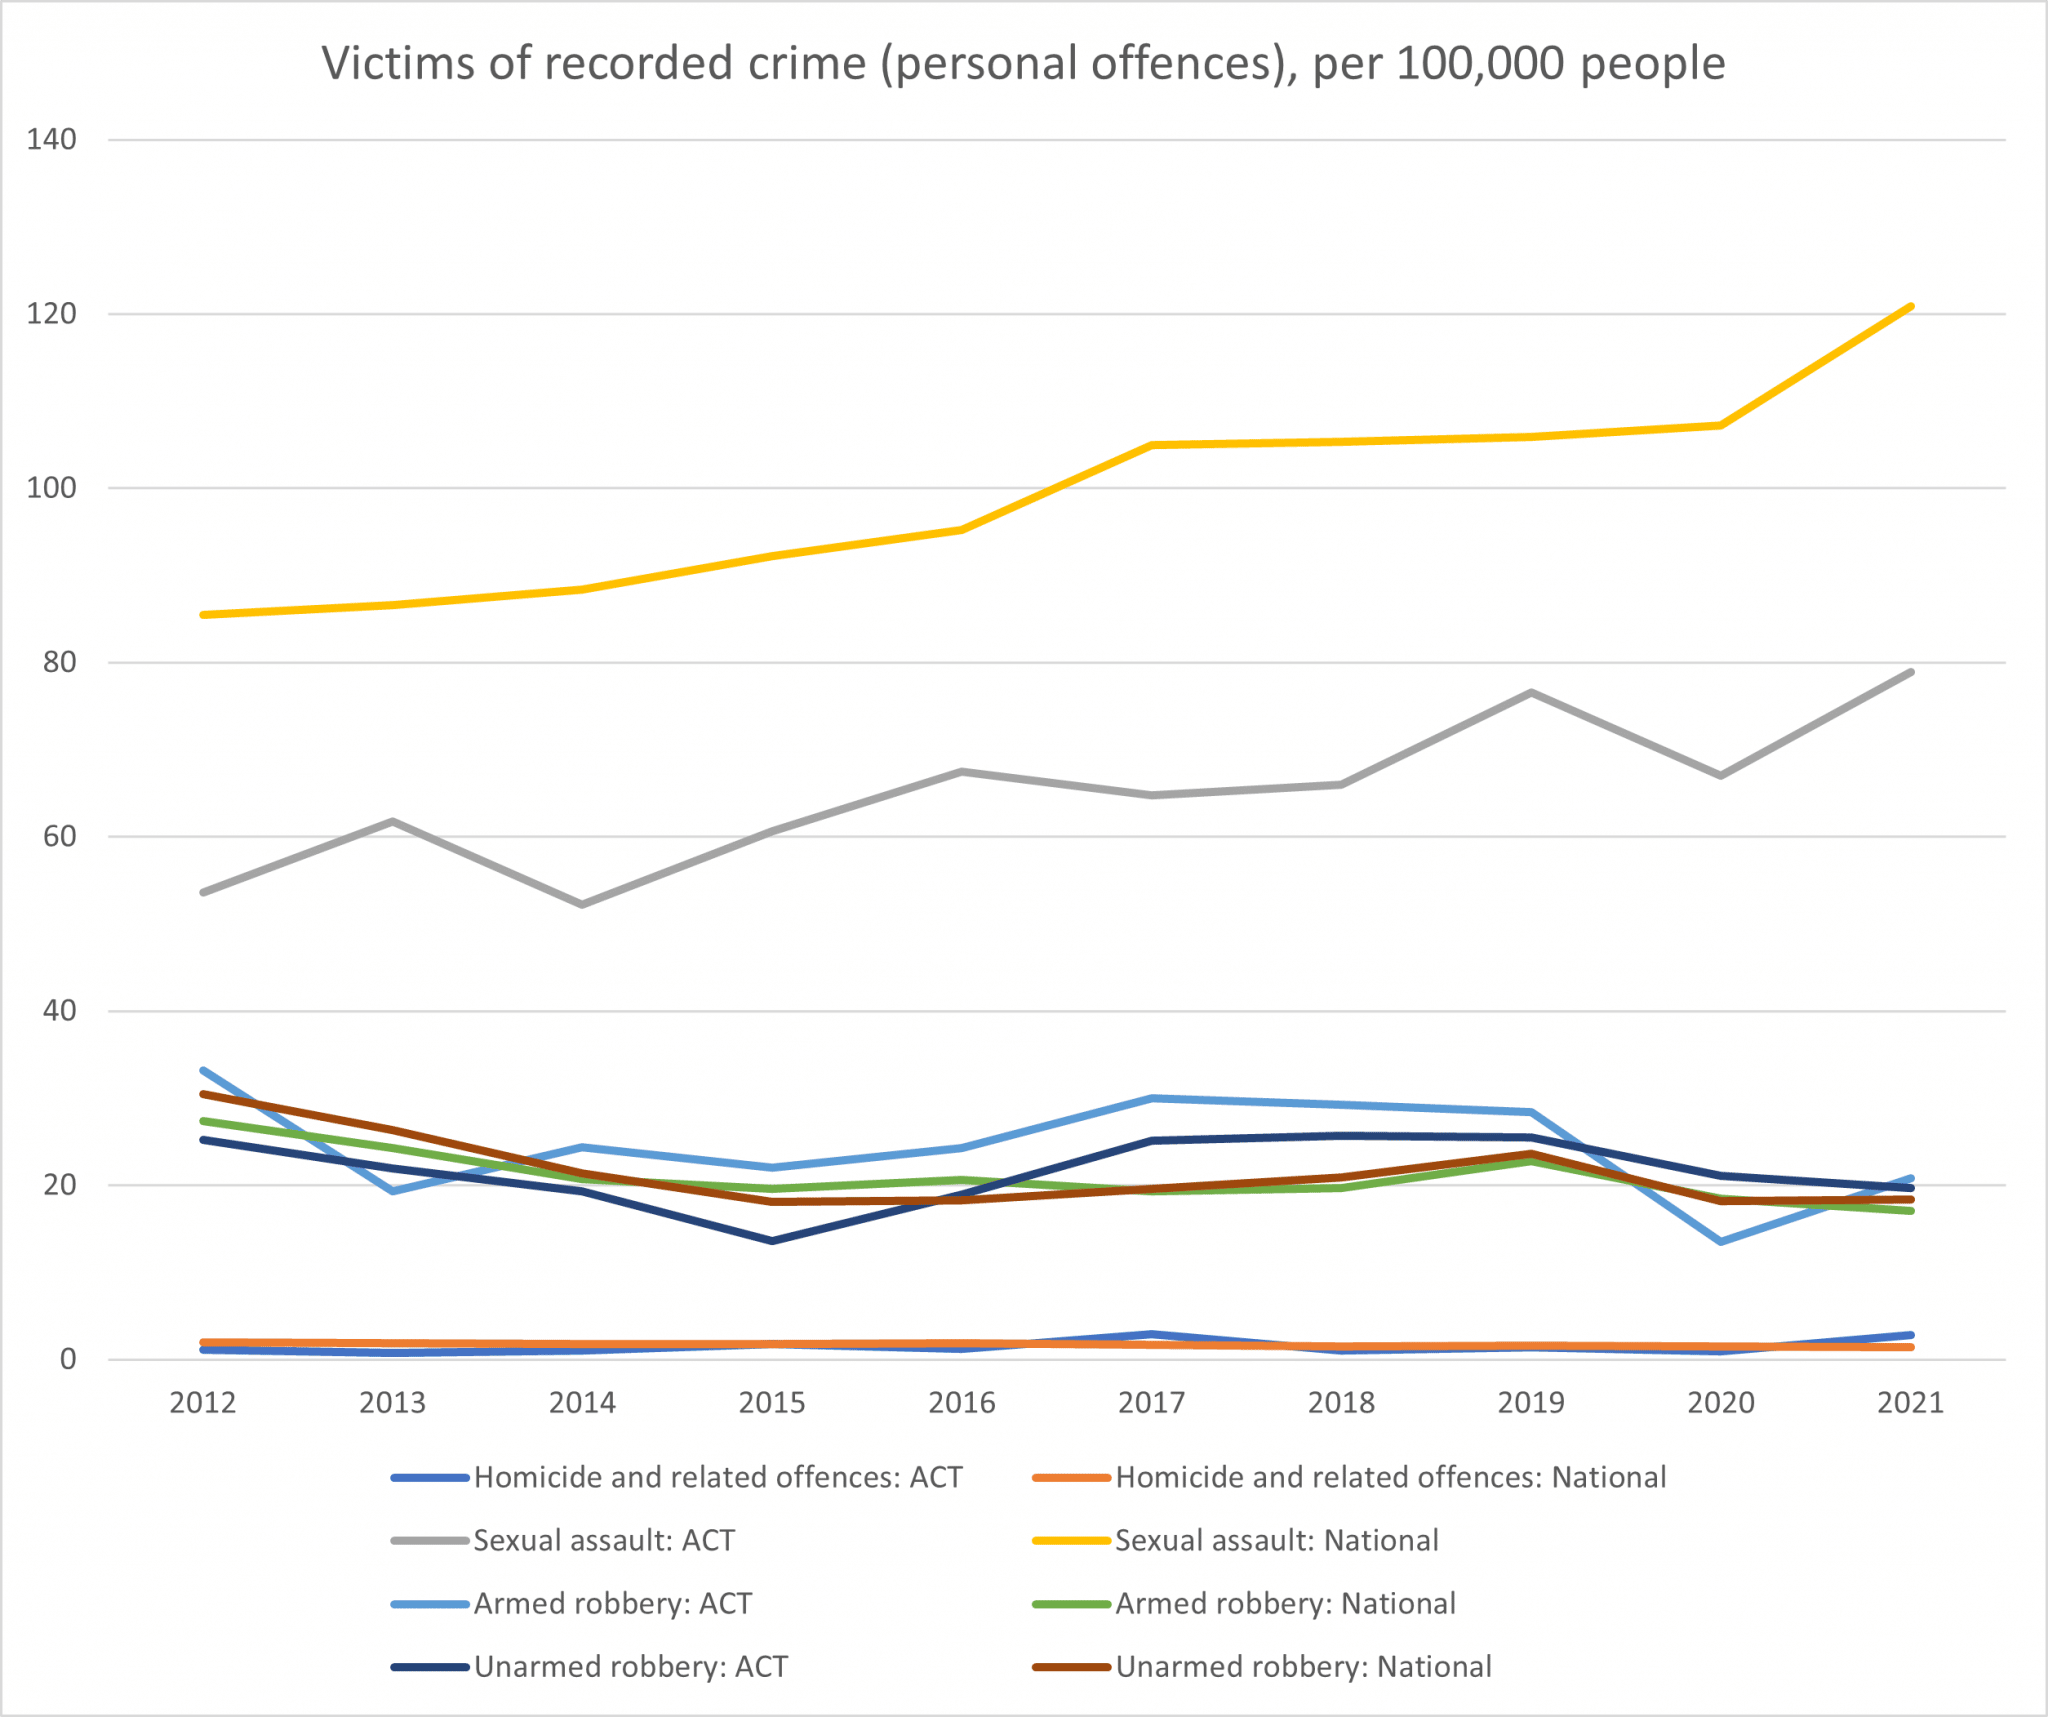
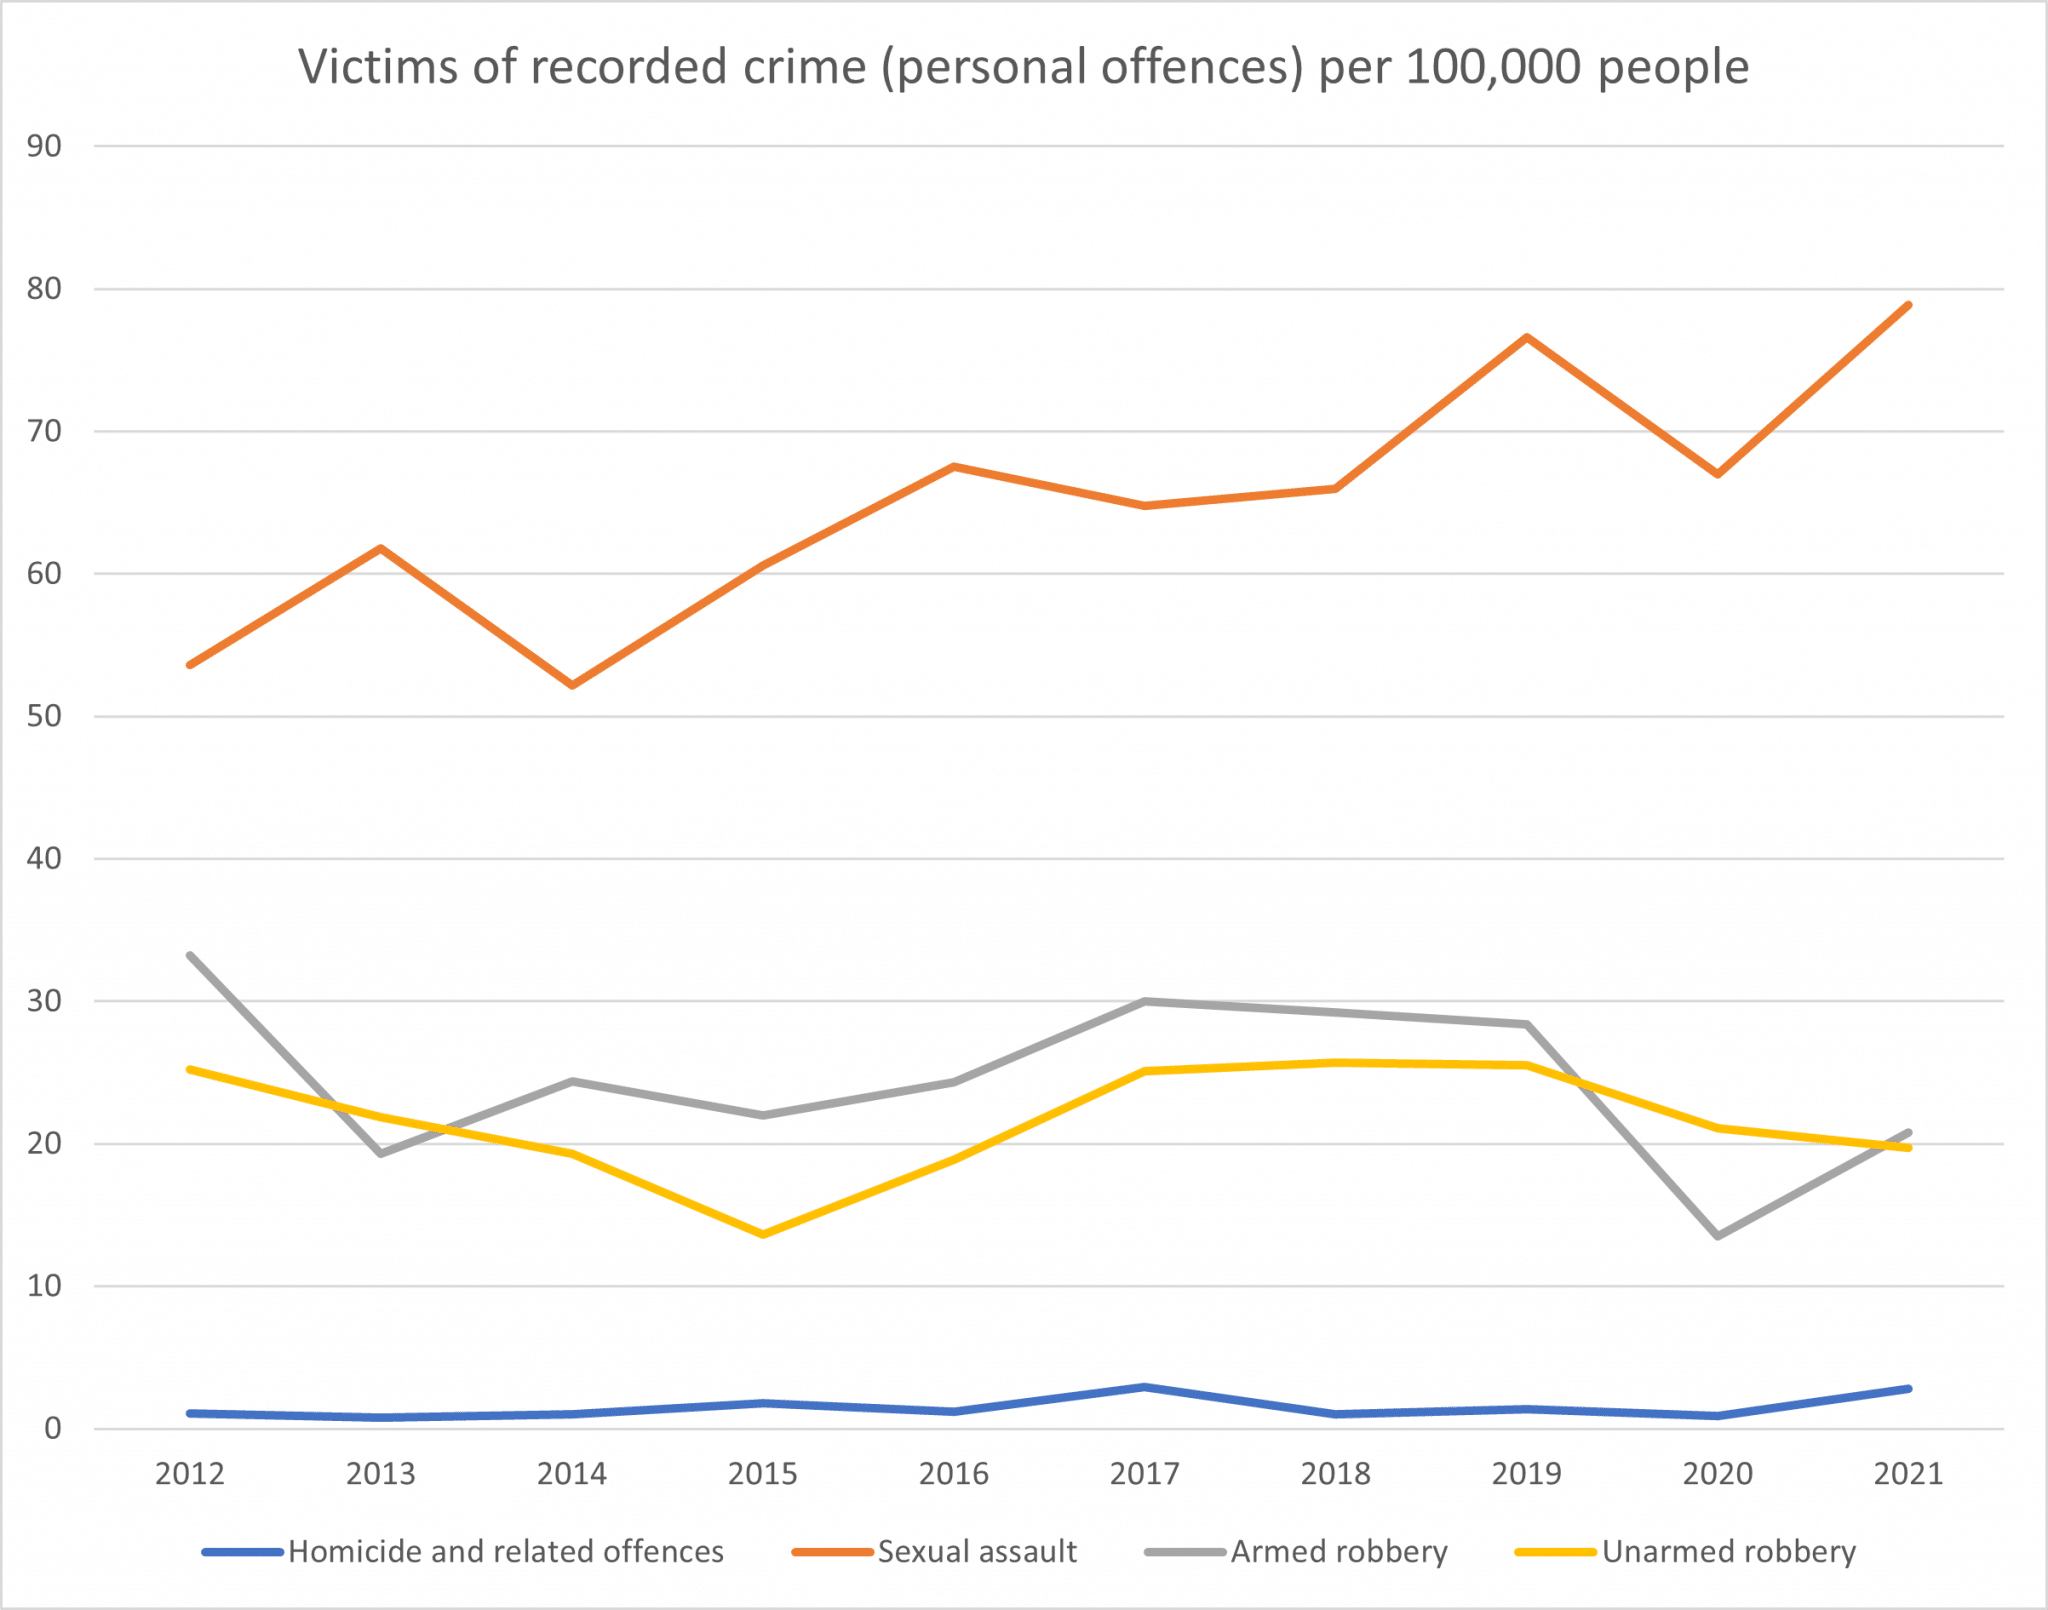
Crime rates for sexual assault, motor vehicle theft (and the very low homicide) have increased – but rates of armed robbery, unarmed robbery, unlawful entry with intent, and other theft have fallen.
| Homicide and related offences | Sexual assault | Armed robbery | Unarmed robbery | |||||
| Year | ACT | Natl | ACT | Natl | ACT | Natl | ACT | Natl |
| 2012 | 1.1 | 2.0 | 53.6 | 85.5 | 33.2 | 27.4 | 25.2 | 30.5 |
| 2013 | 0.8 | 1.9 | 61.8 | 86.6 | 19.3 | 24.3 | 21.9 | 26.3 |
| 2014 | 1.0 | 1.8 | 52.2 | 88.4 | 24.4 | 20.7 | 19.3 | 21.4 |
| 2015 | 1.8 | 1.8 | 60.6 | 92.2 | 22.0 | 19.6 | 13.6 | 18.1 |
| 2016 | 1.2 | 1.9 | 67.5 | 95.2 | 24.3 | 20.6 | 18.9 | 18.3 |
| 2017 | 2.9 | 1.7 | 64.8 | 105.0 | 30.0 | 19.3 | 25.1 | 19.6 |
| 2018 | 1.0 | 1.5 | 66.0 | 105.3 | 29.2 | 19.7 | 25.7 | 20.9 |
| 2019 | 1.4 | 1.6 | 76.6 | 105.9 | 28.4 | 22.8 | 25.5 | 23.6 |
| 2020 | 0.9 | 1.5 | 67.0 | 107.2 | 13.5 | 18.5 | 21.1 | 18.2 |
| 2021 | 2.8 | 1.4 | 78.9 | 120.9 | 20.8 | 17.1 | 19.7 | 18.4 |
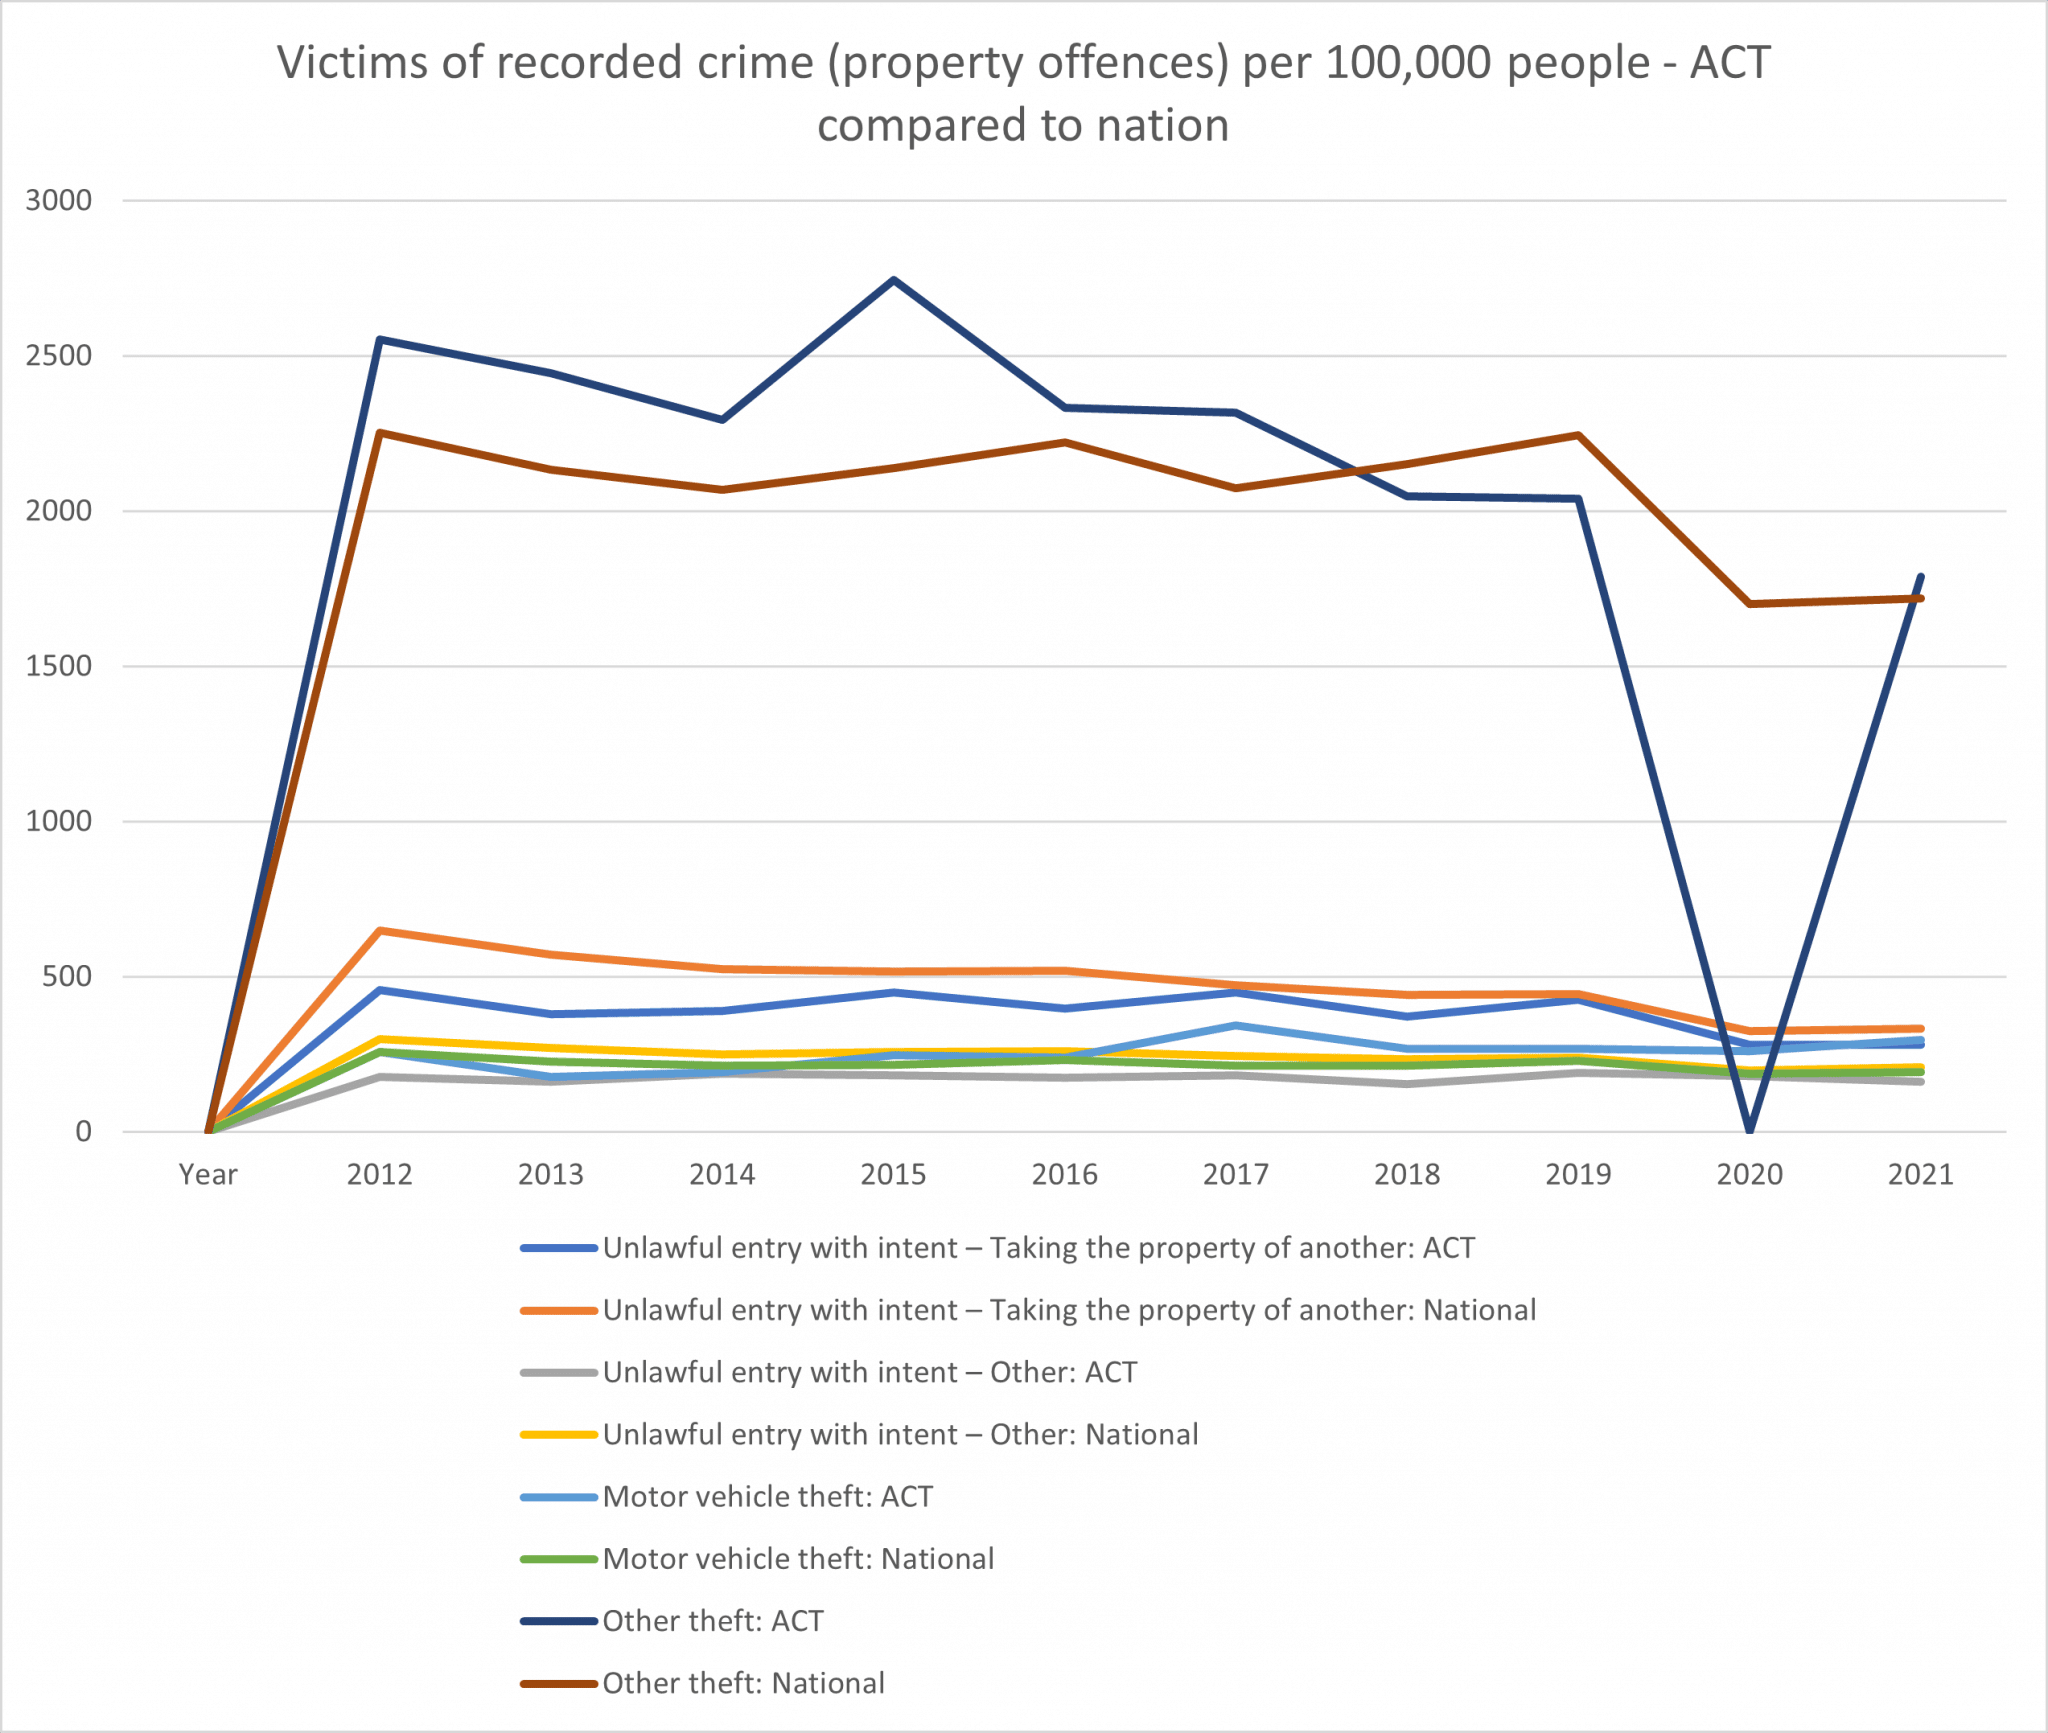
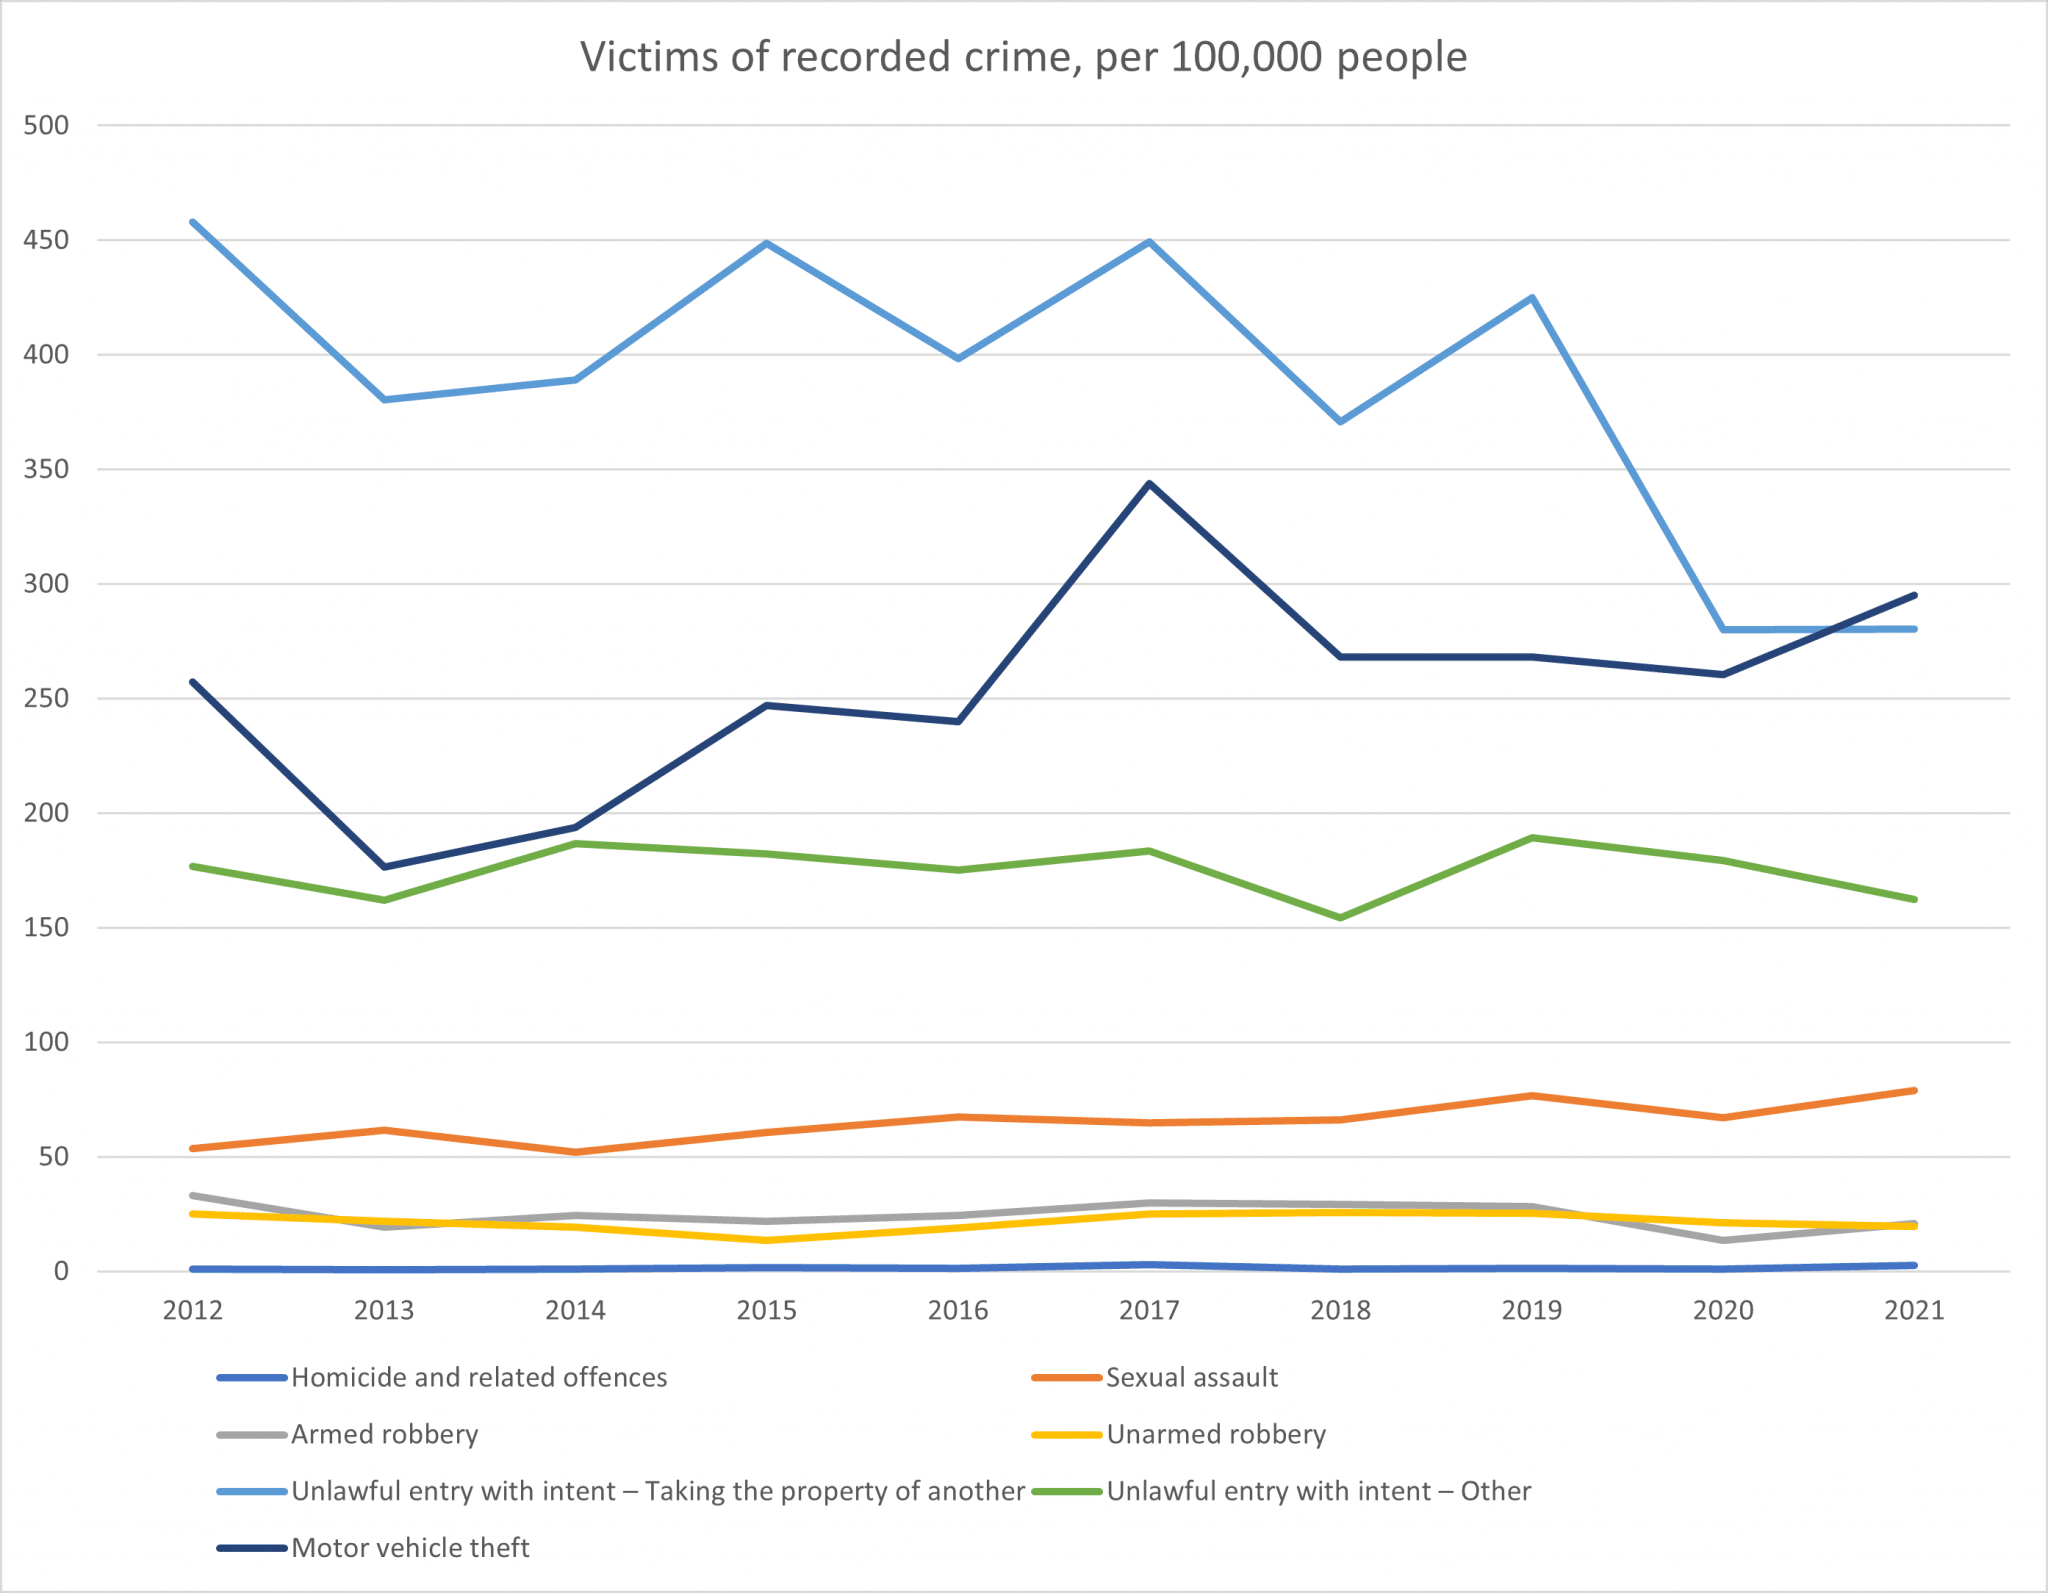
Victims of recorded crime, selected personal offences, per 100,000 people
| Unlawful entry with intent Taking the property of another | Unlawful entry with intent Taking the property of another | Unlawful entry with intent Other | Unlawful entry with intent Other | Motor vehicle theft | Motor vehicle theft | Other theft | Other theft | |
| Year | ACT | Natl | ACT | Natl | ACT | Natl | ACT | Natl |
| 2012 | 458.1 | 647.6 | 176.9 | 298.2 | 257.3 | 257.6 | 2,552.7 | 2,253.7 |
| 2013 | 380.4 | 571.3 | 162.0 | 269.8 | 176.4 | 227.0 | 2,444.1 | 2,133.9 |
| 2014 | 389.1 | 523.8 | 186.7 | 251.0 | 193.7 | 213.8 | 2,294.2 | 2,067.6 |
| 2015 | 448.7 | 515.9 | 182.2 | 256.8 | 247.1 | 216.3 | 2,744.7 | 2,139.9 |
| 2016 | 398.2 | 520.4 | 175.1 | 259.8 | 239.9 | 231.7 | 2,333.1 | 2,221.0 |
| 2017 | 449.2 | 471.3 | 183.5 | 245.3 | 343.7 | 213.2 | 2,318.3 | 2,074.9 |
| 2018 | 370.9 | 440.8 | 154.4 | 235.4 | 268.0 | 213.6 | 2,049.2 | 2,150.9 |
| 2019 | 425.1 | 443.7 | 189.4 | 239.7 | 268.3 | 228.6 | 2,040.5 | 2,244.3 |
| 2020 | 280.0 | 324.5 | 179.3 | 196.6 | 260.3 | 187.2 | 16,21.8 | 1,699.8 |
| 2021 | 280.4 | 332.4 | 162.2 | 208.0 | 295.2 | 193.3 | 1,788.9 | 1,719.0 |
Low rate of convictions
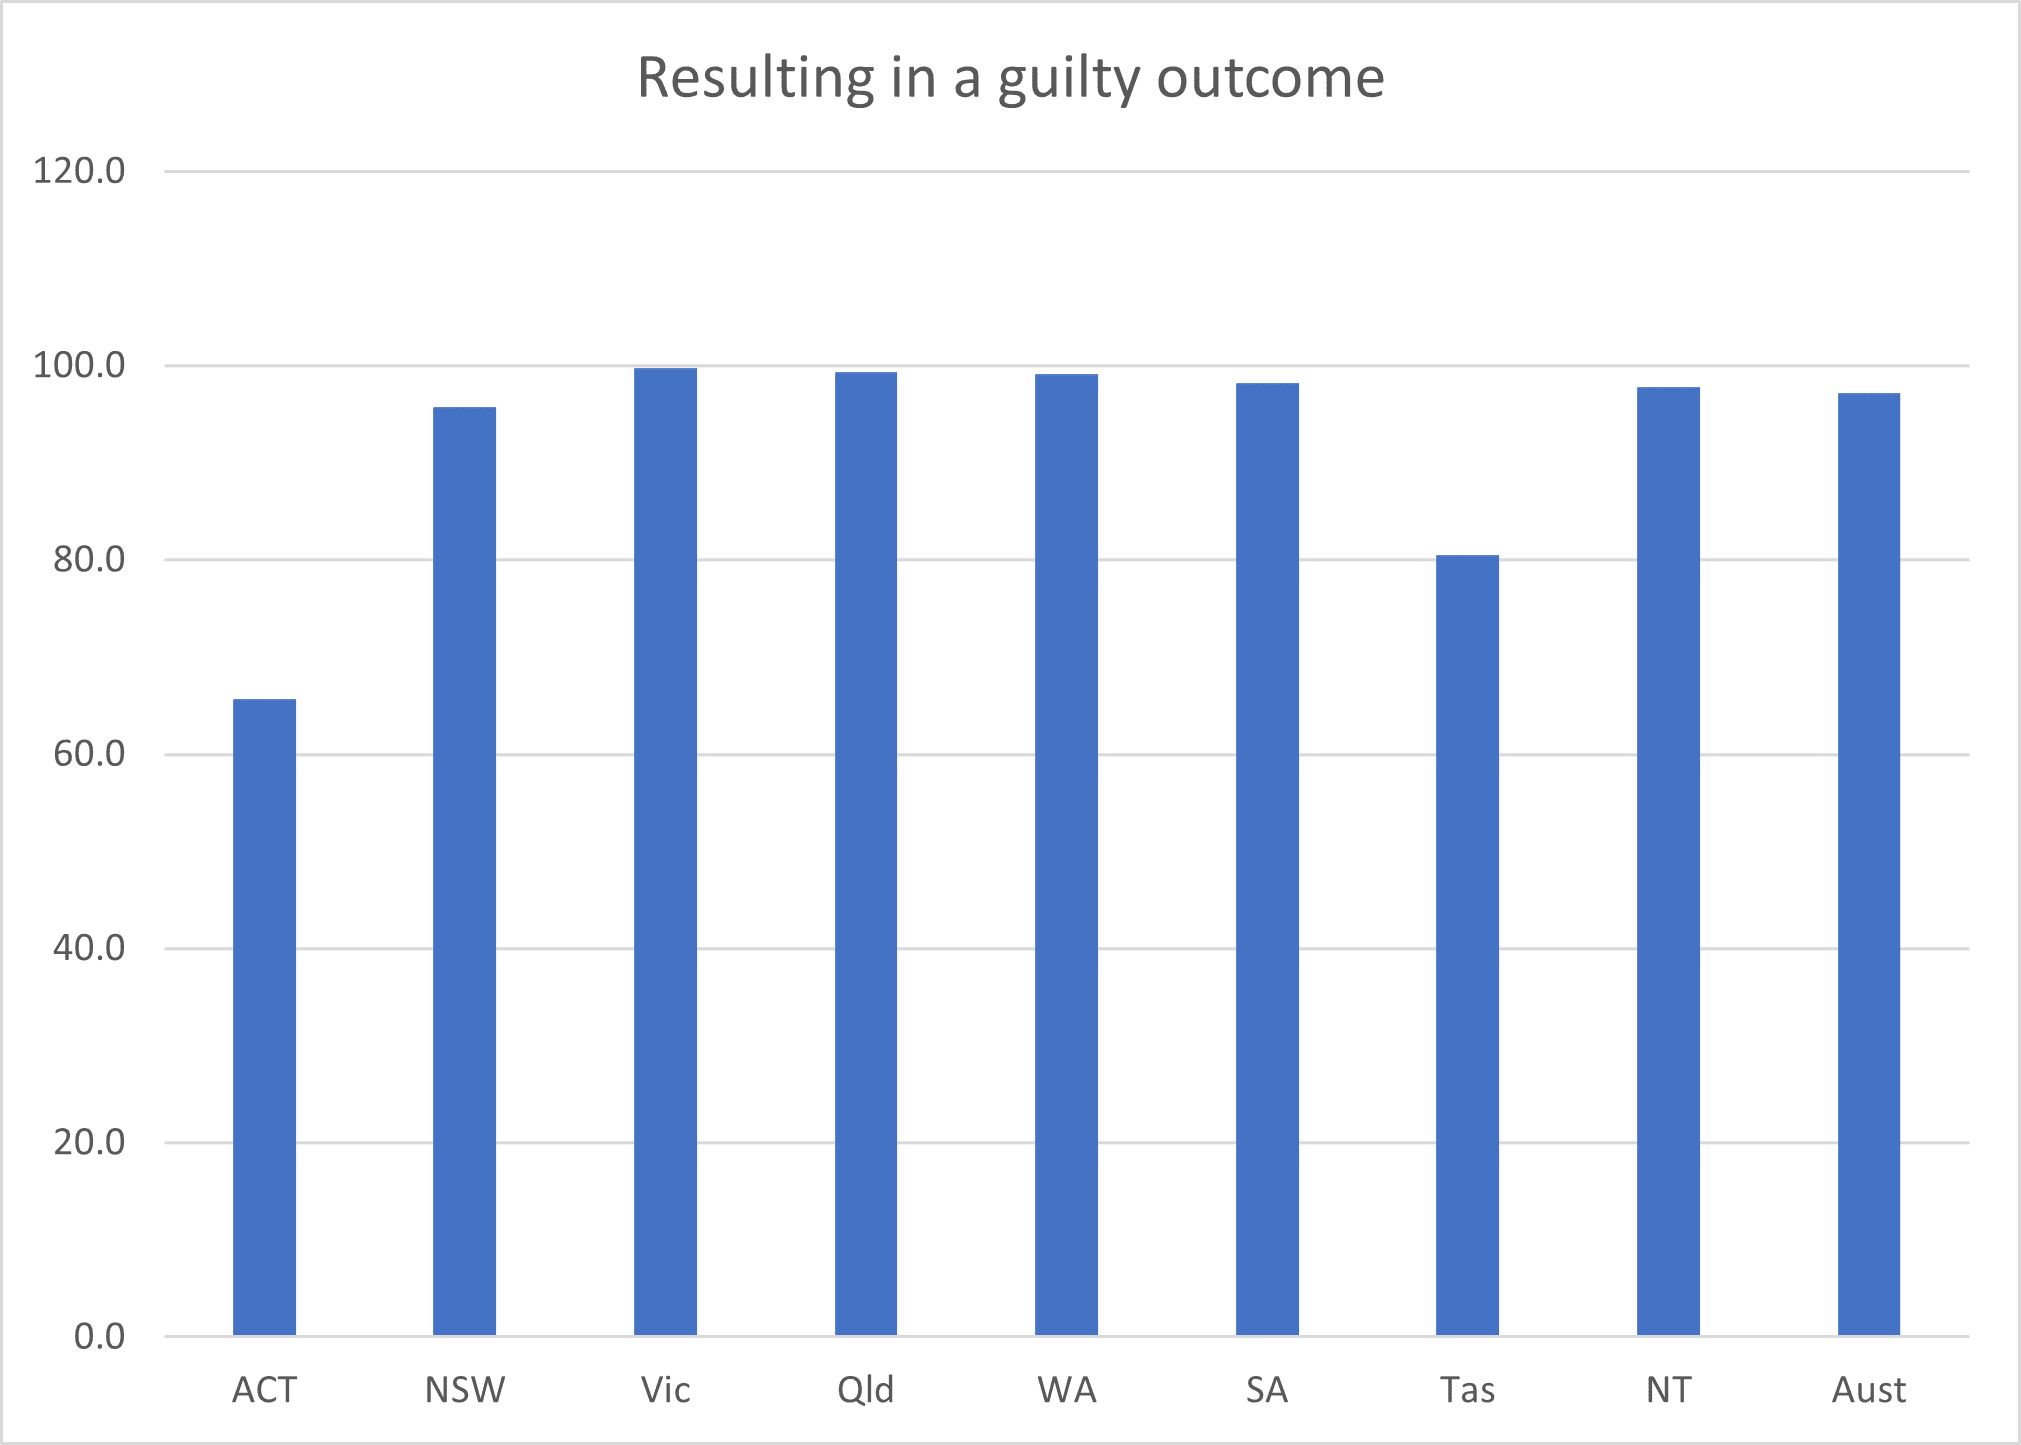
Magistrates court decisions resulting in a guilty outcome for defendants are the lowest in the nation (by more than 30 points below the national average).
| Year | Resulting in a guilty outcome (%) | Australia (%) | Total decisions | Total guilty outcome |
| 2018–19 | 91.8 (2nd lowest) | 97.9 | 3,911 | 3,591 |
| 2019–20 | 64.8 (LOWEST) | 97.5 | 4,234 | 2,743 |
| 2020–21 | 65.7 (LOWEST) | 97.2 | 4,899 | 3,217 |
Alex Caruana, president of the AFPA, said the data from the judiciary and courts was concerning.
“This data highlights the reason why we need an independent inquiry into the judicial system in the ACT,” he said. “Why has the conviction rate dropped from the 90 per cent range to the mid 60 per cent range?”
Last year, the AFPA, the Canberra Liberals, and bereaved parent Tom McLuckie called for bail and sentencing to be reformed; recidivist offenders were being granted bail or given light sentences, putting the public at risk, Mr Caruana said then. But the government rejected Jeremy Hanson’s motion for an independent review.
- Reform of bail and sentencing in ACT needed, AFPA says (25 August 2022)
- Fight for independent review of bail is not yet over (12 October 2022)
Satisfaction with police
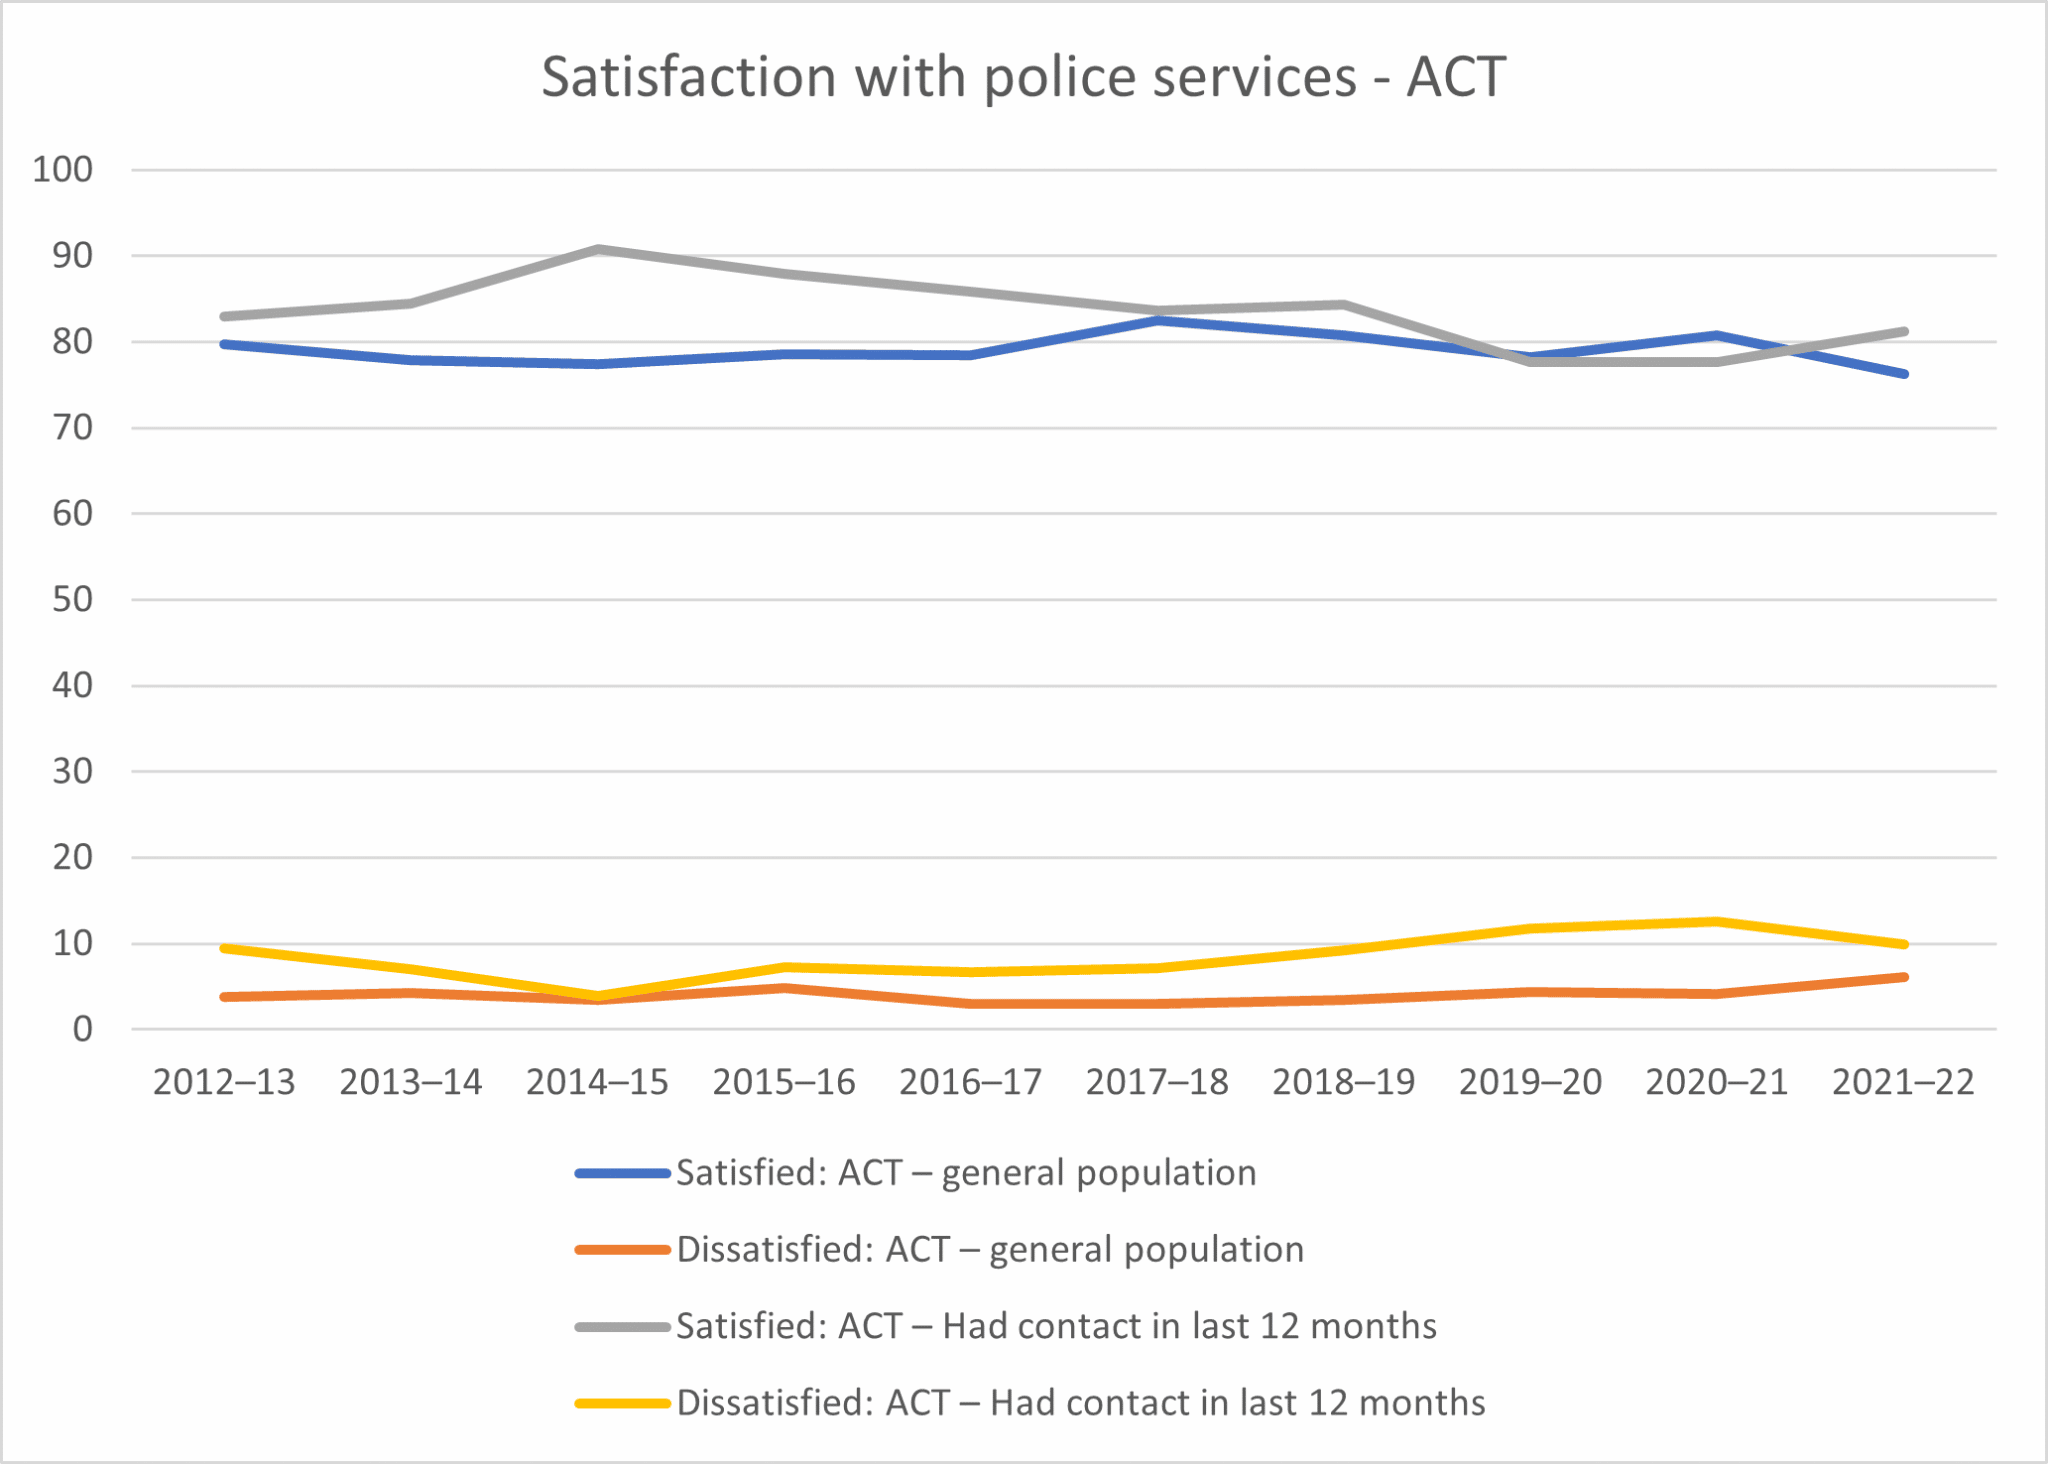
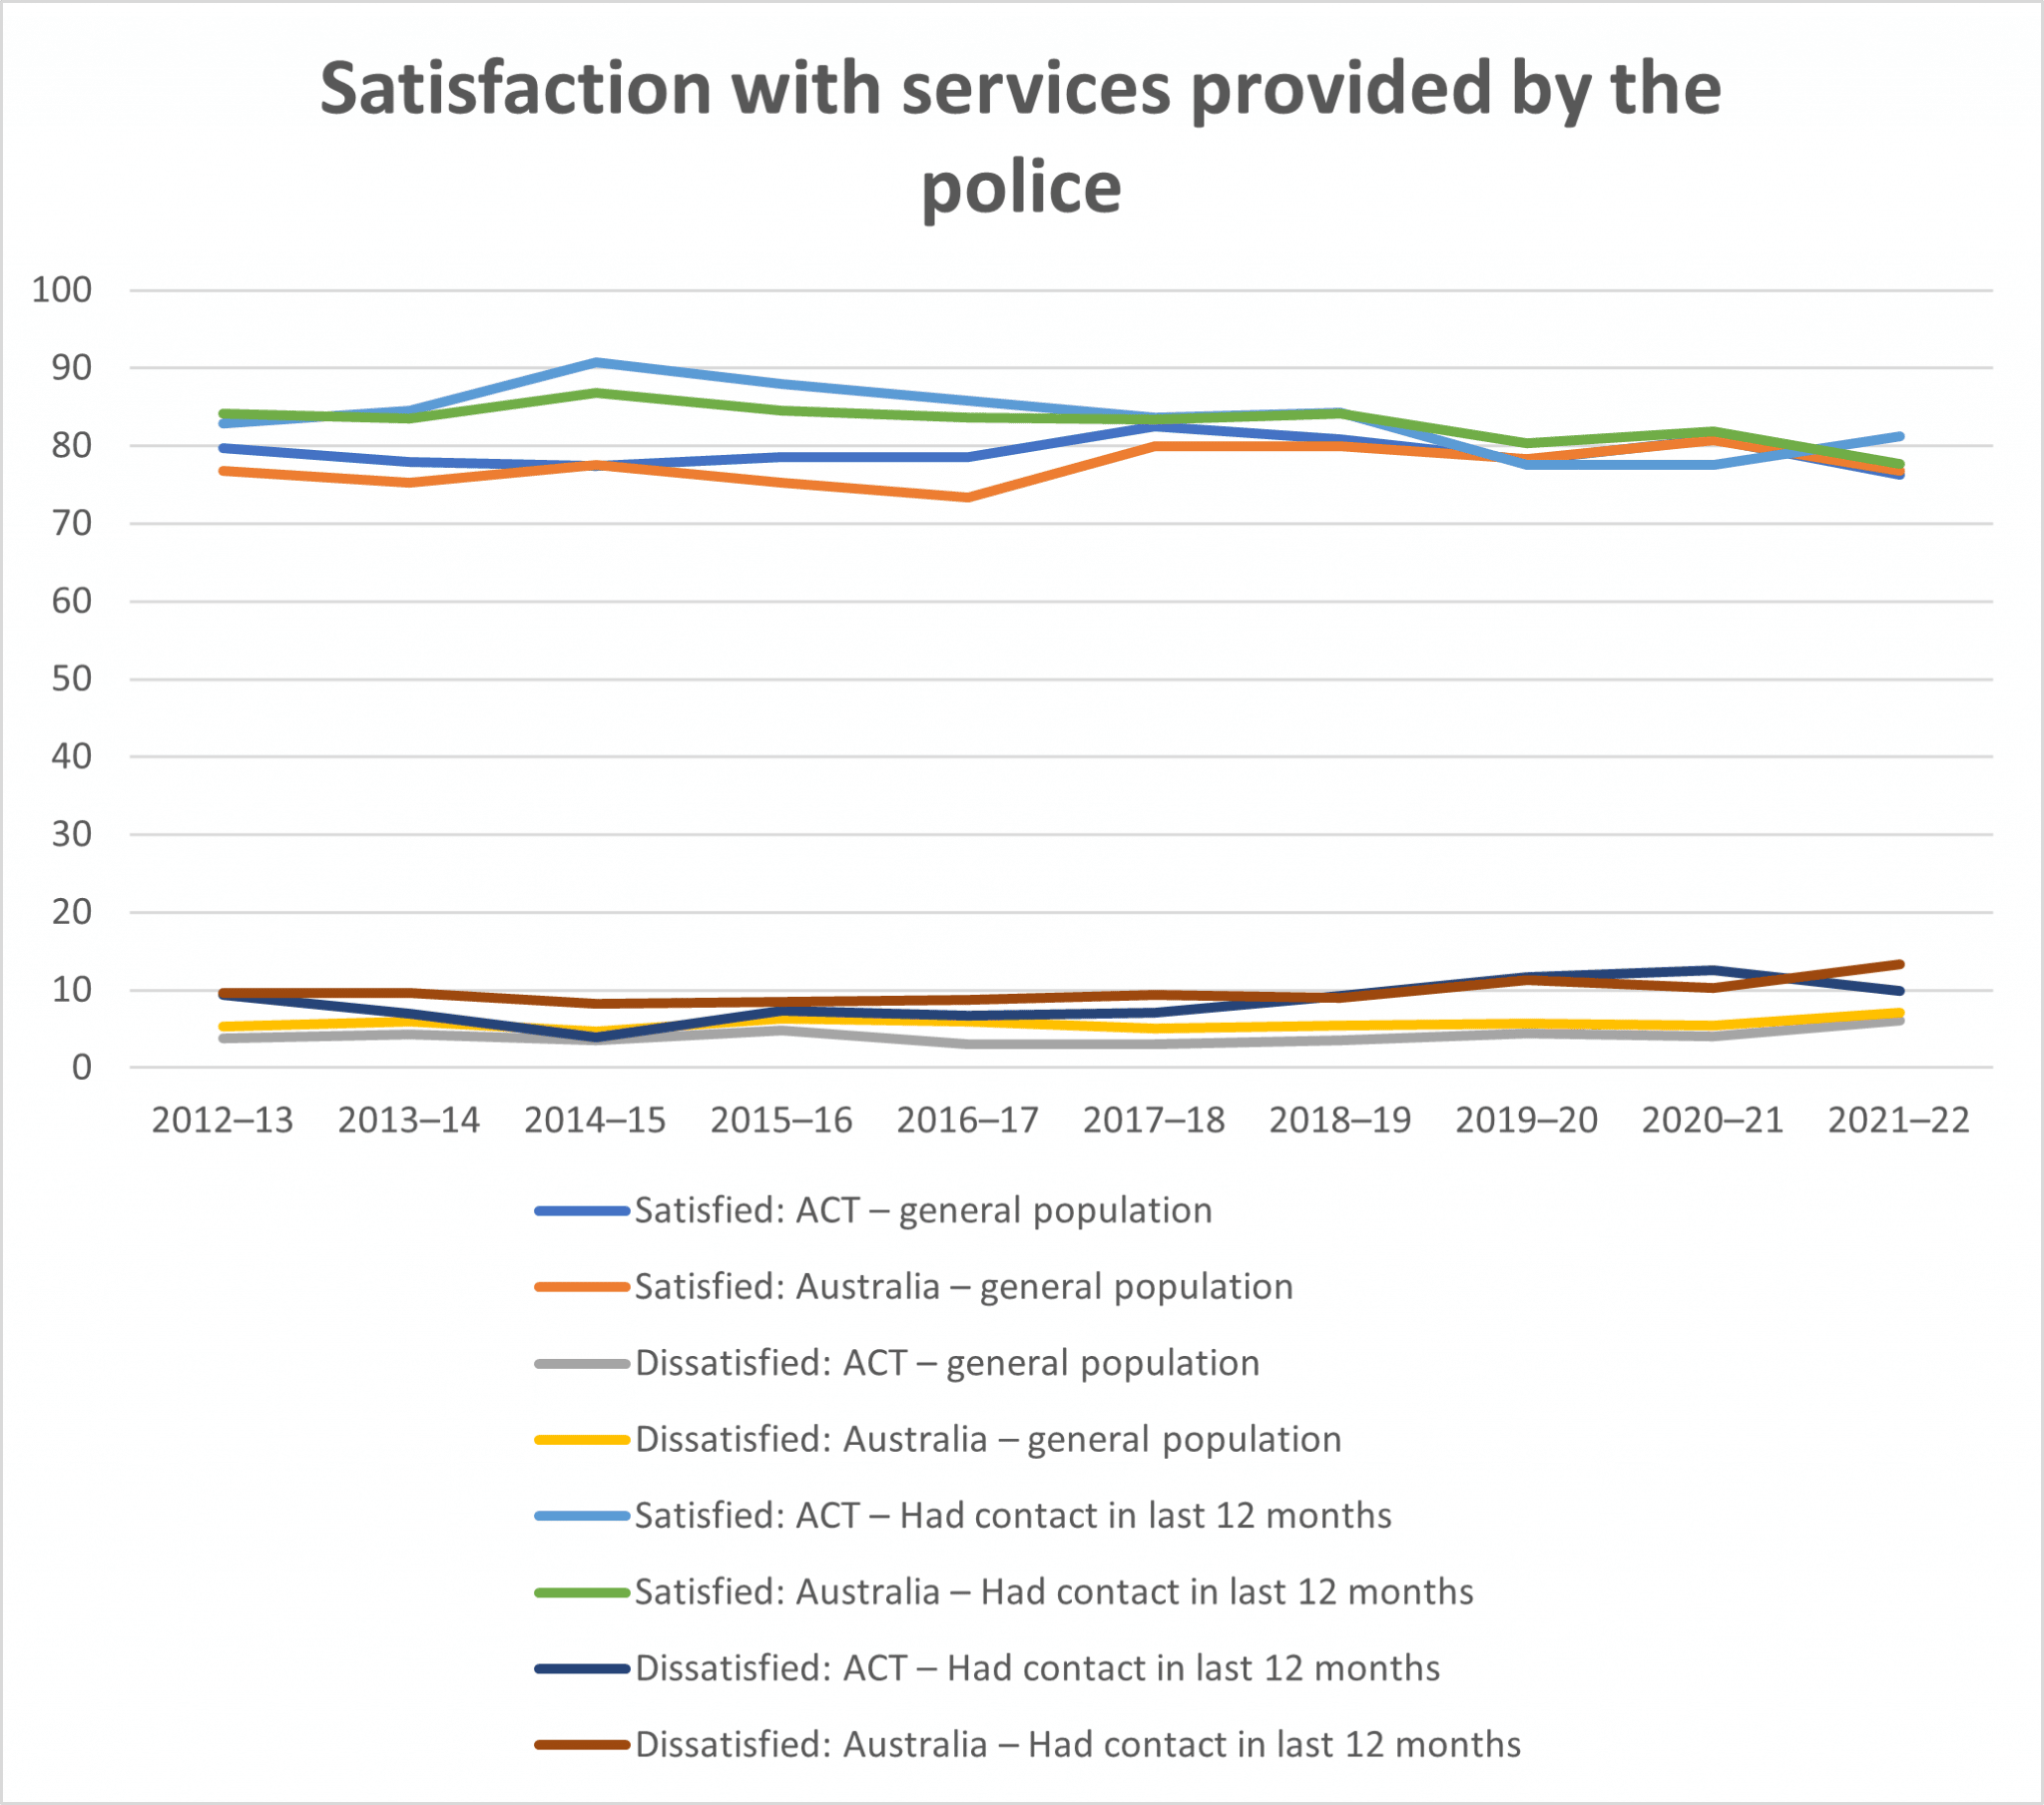
The general population’s satisfaction with services provided by the police is at its lowest in 10 years. Those who have had contact with police in the last 12 months are more satisfied than they were in the previous two years, however.
| Year | General public: Satisfied | Australia | General public: Dissatisfied | Australia | Had contact in last 12 months: Satisfied | Australia | Had contact in last 12 months: Dissatisfied | Australia |
| 2012–13 | 79.7 | 76.8 | 3.8 | 5.3 | 82.9 | 84.1 | 9.4 | 9.7 |
| 2013–14 | 77.9 | 75.3 | 4.3 | 5.9 | 84.5 | 83.5 | 7.0 | 9.6 |
| 2014–15 | 77.4 | 77.5 | 3.5 | 4.7 | 90.8 | 86.8 | 3.9 | 8.3 |
| 2015–16 | 78.6 | 75.2 | 4.8 | 6.3 | 87.9 | 84.5 | 7.3 | 8.5 |
| 2016–17 | 78.5 | 73.4 | 3.0 | 6.0 | 85.8 | 83.6 | 6.7 | 8.7 |
| 2017–18 | 82.5 | 79.9 | 3.0 | 5.1 | 83.6 | 83.4 | 7.1 | 9.4 |
| 2018–19 | 80.8 | 79.9 | 3.5 | 5.4 | 84.3 | 84.1 | 9.2 | 9.0 |
| 2019–20 | 78.2 | 78.3 | 4.4 | 5.7 | 77.6 | 80.4 | 11.7 | 11.3 |
| 2020–21 | 80.8 | 80.7 | 4.1 | 5.4 | 77.6 | 81.9 | 12.6 | 10.3 |
| 2021–22 | 76.3 | 76.8 | 6.1 | 7.1 | 81.2 | 77.7 | 9.9 | 13.3 |
Mr Caruana believed the drop in community satisfaction was linked directly to officer numbers.
“Of course people aren’t going to be satisfied if police take a long time to turn up, or take a long time to investigate an incident,” he said. “This is a direct result of police being too thin on the ground, and having to go job-to-job and becoming overworked.”
Canberrans trust police
However, police rate highly on integrity and trust. 85.5 per cent of Canberrans believe police perform their job professionally (the second highest rating in Australia); 73.2 per cent believe police are honest (the highest rating); and 69 per cent believe police treat people fairly and equally.
| Statement | ACT | NSW | Vic | Qld | WA | SA | Tas | NT | Aust |
| “Police perform job professionally”: Agree | 85.5 | 79.5 | 81.3 | 82.6 | 86.8 | 85.3 | 85.2 | 78.3 | 82.0 |
| “Police treat people fairly and equally”: Agree | 69.0 | 61.6 | 67.3 | 67.5 | 71.7 | 69.2 | 73.8 | 66.7 | 66.3 |
| “Police are honest”: Agree | 73.2 | 65.8 | 69.4 | 67.5 | 73.0 | 72.8 | 72.4 | 72.4 | 68.6 |
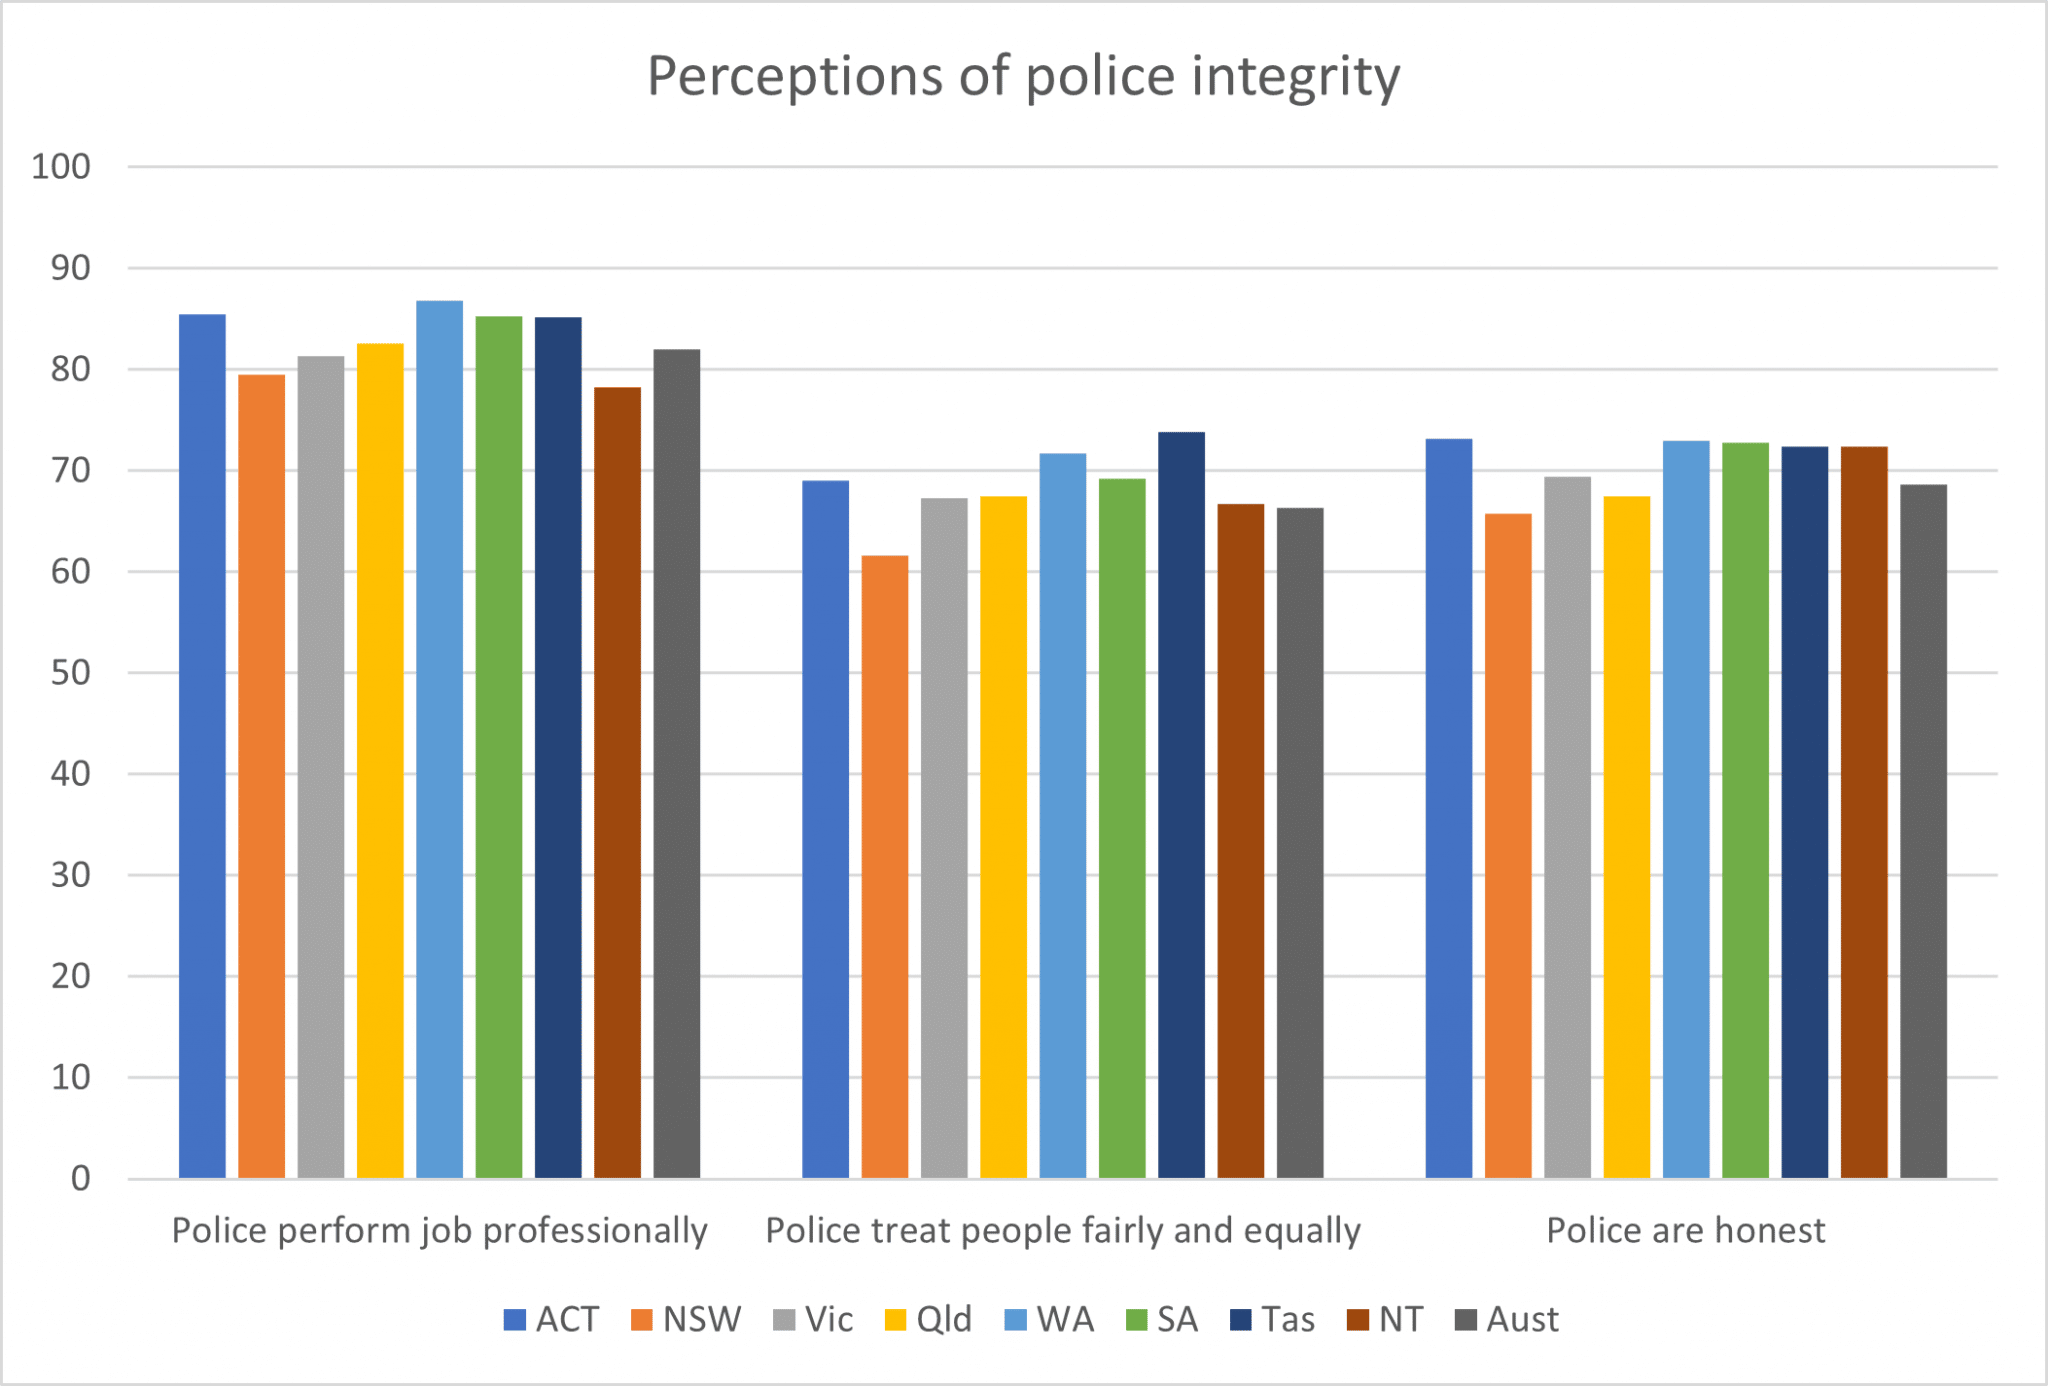
“In community policing, integrity and trust is important, and this data portrays the ACT Policing workforce positively,” Mr Caruana said.
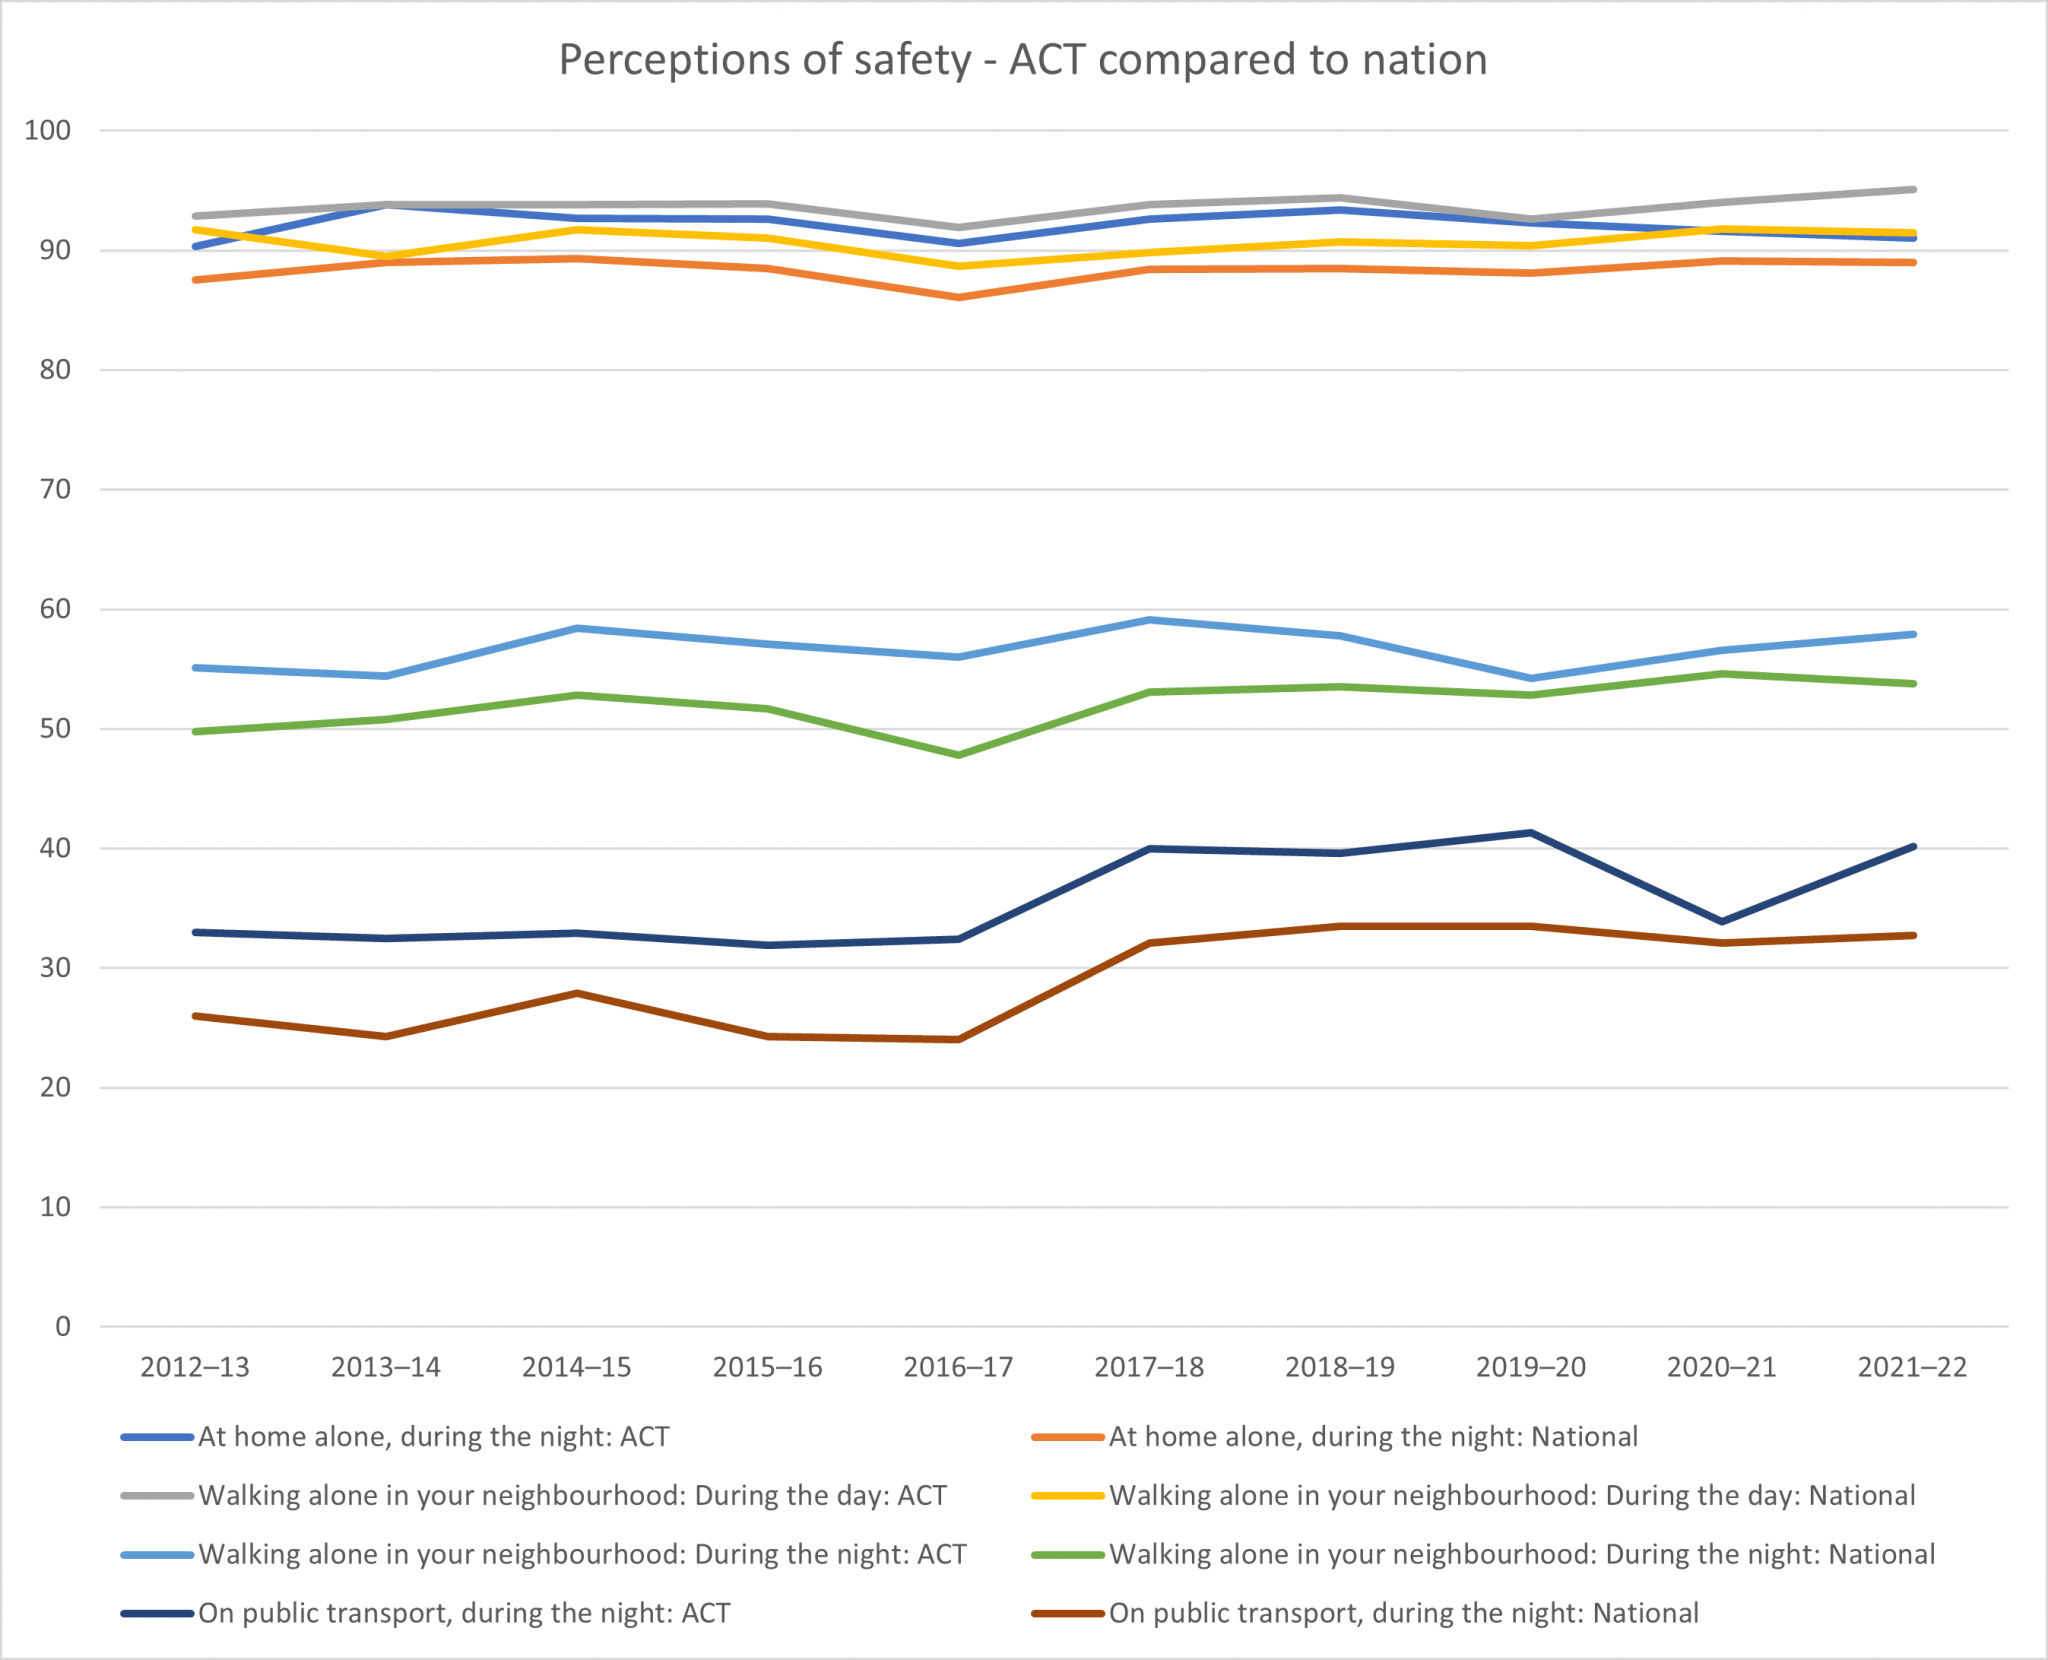
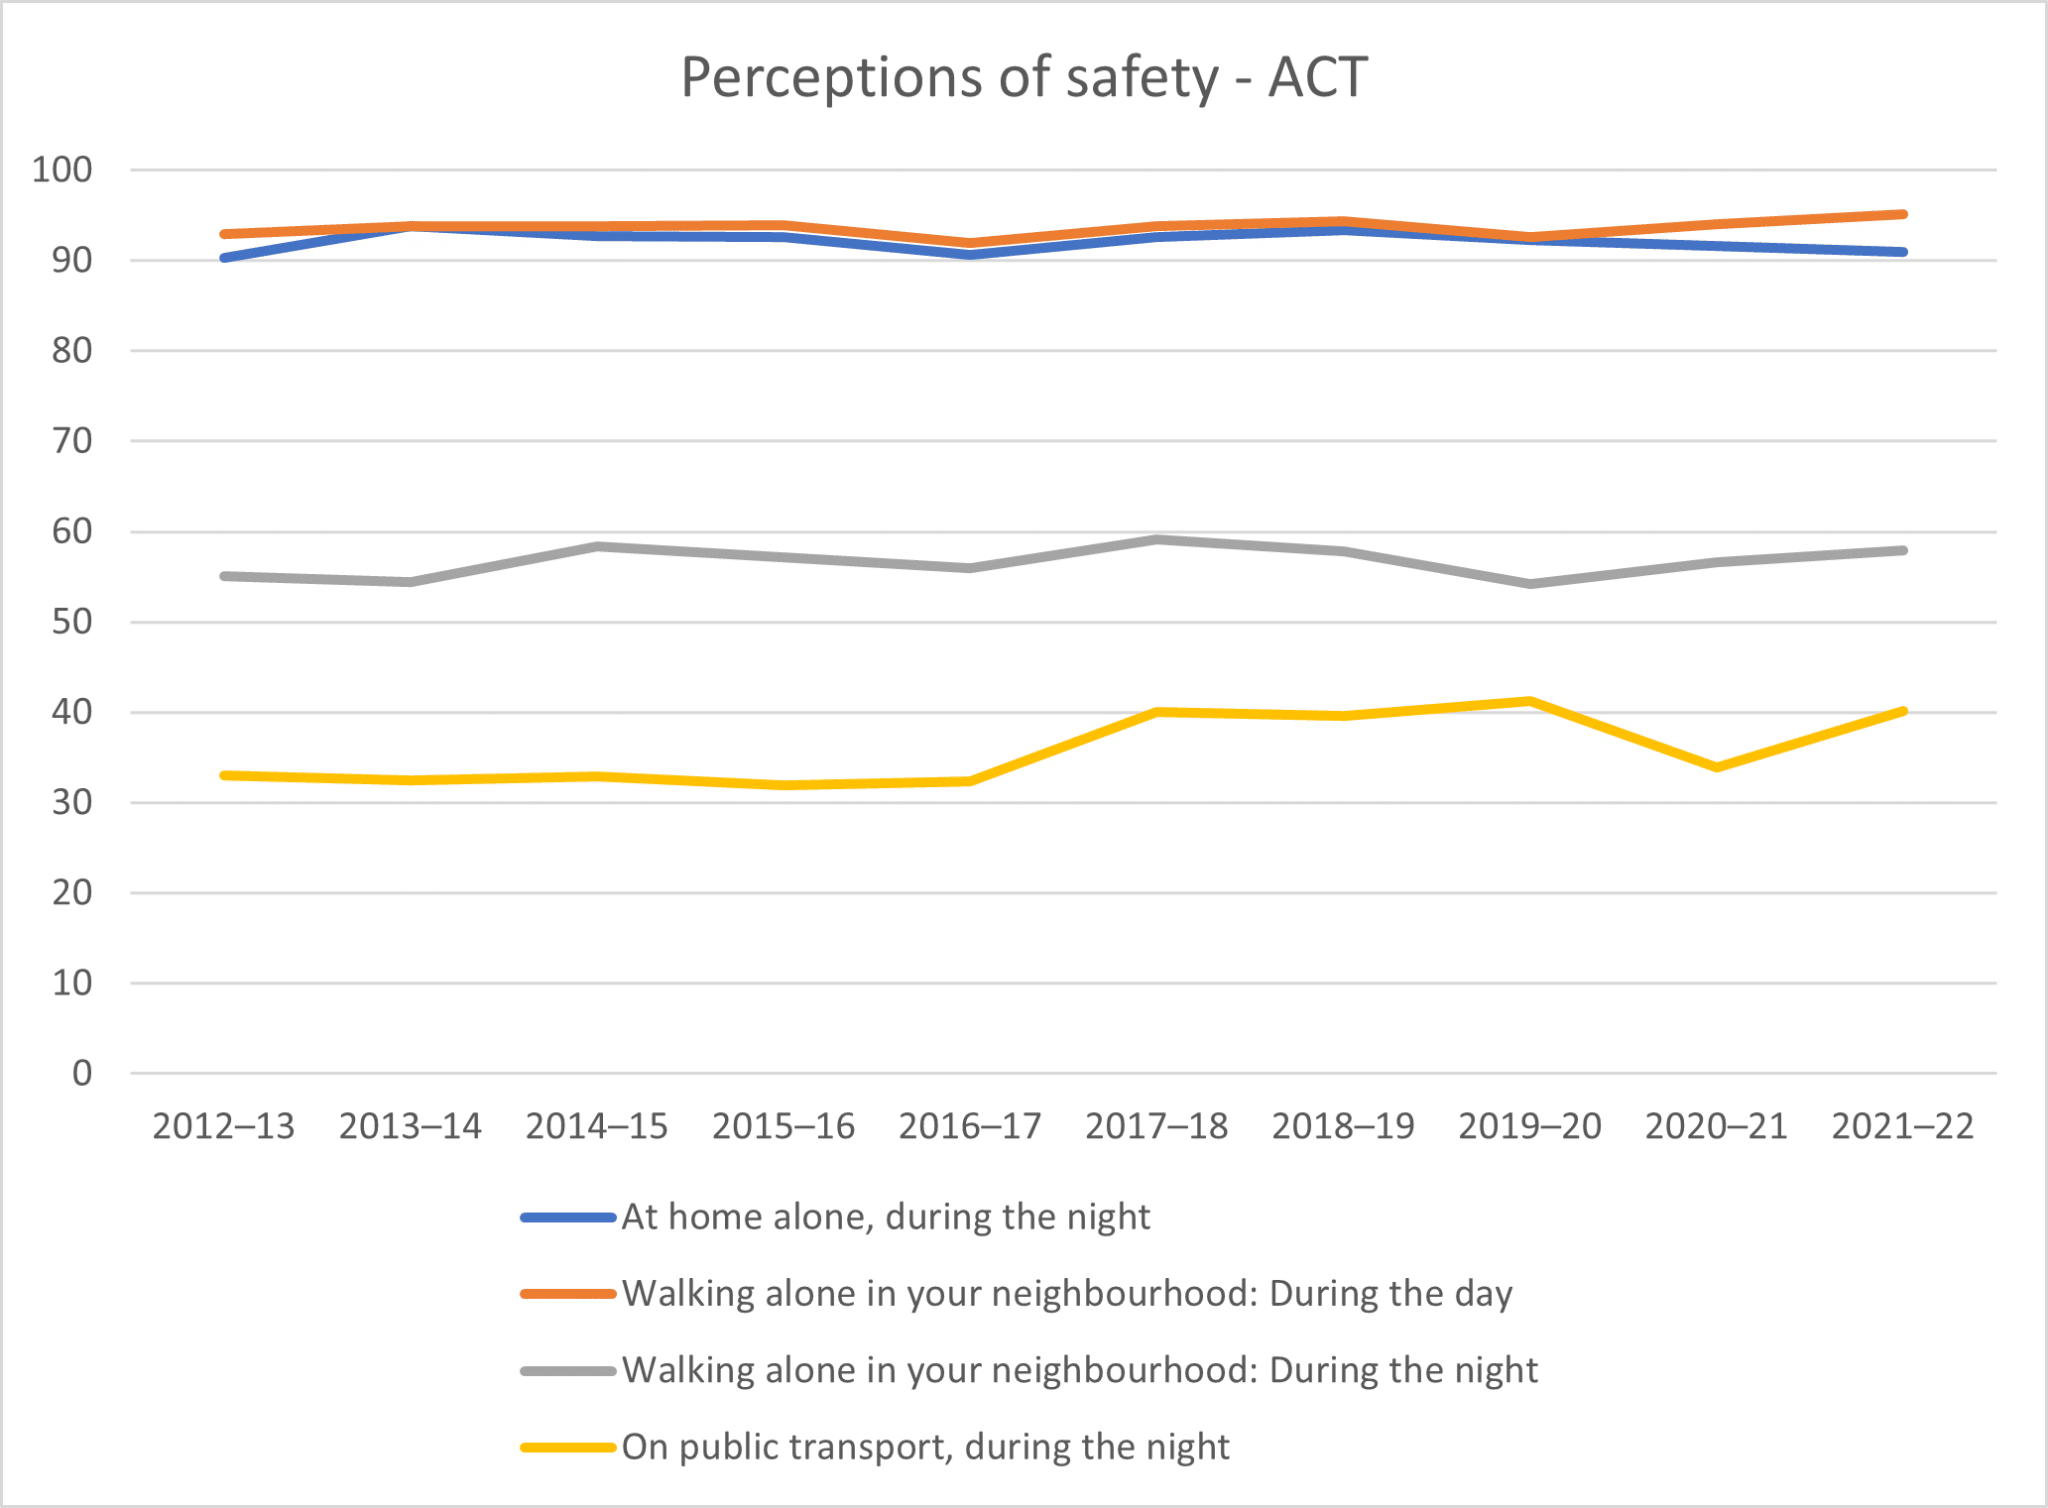
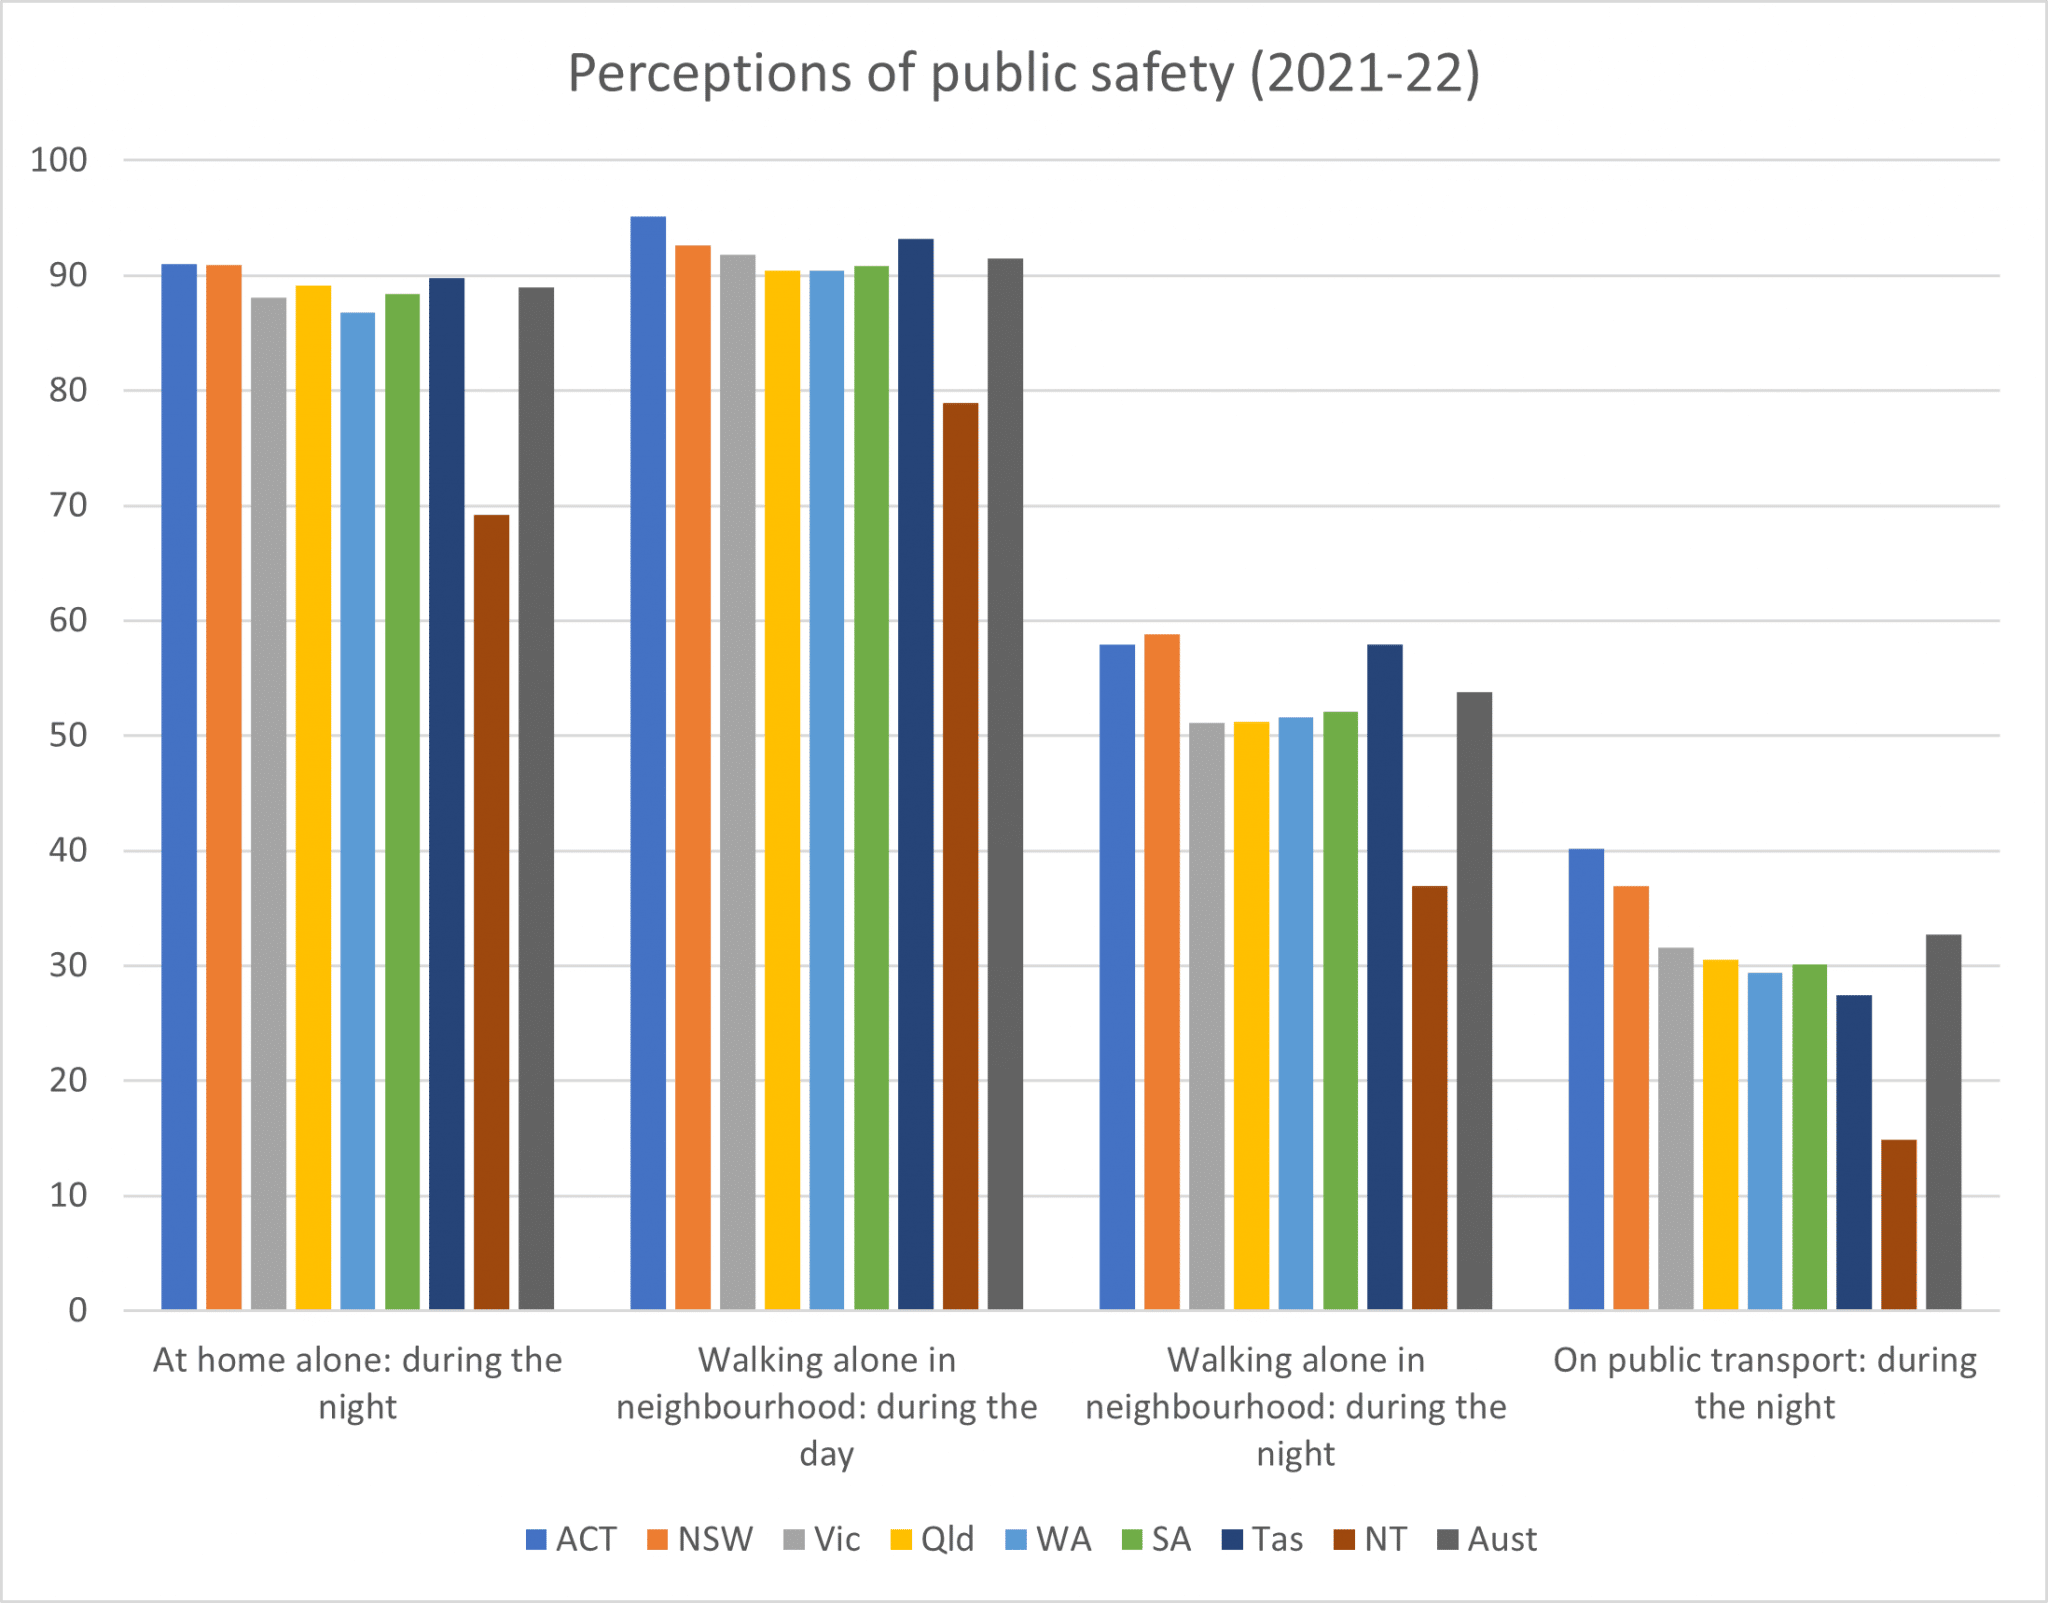
Perceptions of safety
ROGS data showed that Canberrans have some of the highest perceptions of safety at home and in public places, Mick Gentleman, ACT Minister for Police and Emergency Services, noted. The ACT leads the nation on people who feel safe at home alone during the night, walking alone in their neighbourhood during the day, and on public transport during the night, and ranks equal second on people who feel safe walking alone in their neighbourhood during the night.
| Year | At home alone, during the night | National | Walking alone in your neighbourhood: During the day | National | Walking alone in your neighbourhood: During the night | National | On public transport, during the night | National |
| 2012–13 | 90.3 | 87.5 | 92.9 | 91.7 | 55.1 | 49.8 | 33.0 | 26.0 |
| 2013–14 | 93.8 | 89.0 | 93.8 | 89.5 | 54.4 | 50.8 | 32.5 | 24.3 |
| 2014–15 | 92.7 | 89.3 | 93.8 | 91.7 | 58.4 | 52.8 | 32.9 | 27.9 |
| 2015–16 | 92.6 | 88.5 | 93.9 | 91.0 | 57.1 | 51.7 | 31.9 | 24.3 |
| 2016–17 | 90.6 | 86.1 | 91.9 | 88.7 | 56.0 | 47.8 | 32.4 | 24.0 |
| 2017–18 | 92.6 | 88.4 | 93.8 | 89.8 | 59.1 | 53.1 | 40.0 | 32.1 |
| 2018–19 | 93.4 | 88.5 | 94.4 | 90.7 | 57.8 | 53.5 | 39.6 | 33.5 |
| 2019–20 | 92.3 | 88.1 | 92.6 | 90.4 | 54.2 | 52.8 | 41.3 | 33.5 |
| 2020–21 | 91.6 | 89.1 | 94.0 | 91.8 | 56.6 | 54.6 | 33.9 | 32.1 |
| 2021–22 | 91.0 | 89.0 | 95.1 | 91.5 | 57.9 | 53.8 | 40.2 | 32.7 |
Perceptions of safety
The ACT has low crime rates compared to other jurisdictions, and the number of offences reported to police in the last decade decreased by 11 per cent, Mr Gentleman continued.
| ACT | NSW | Vic | Qld | WA | SA | Tas | NT | National | |
| 2021 | |||||||||
| Homicide | 2.8 | 1.0 | 1.3 | 1.6 | 1.8 | 2.0 | 1.7 | 5.3 | 1.4 |
| Sexual assault | 78.9 | 141.0 | 92.7 | 132.0 | 132.9 | 100.6 | 86.8 | 144.1 | 120.9 |
| Armed robbery | 20.8 | 10.5 | 20.3 | 21.8 | 19.9 | 15.1 | 8.9 | 37.8 | 17.1 |
| Unarmed robbery | 19.7 | 14.3 | 15.5 | 25.7 | 24.7 | 14.4 | 13.1 | 50.7 | 18.4 |
| 2020 | |||||||||
| Homicide | 0.9 | 1.2 | 1.5 | 1.8 | 2.2 | 1.6 | 0.6 | 4.9 | 1.5 |
| Sexual assault | 67.0 | 138.1 | 82.3 | 98.9 | 114.5 | 91.8 | 56.8 | 150.4 | 107.2 |
| Armed robbery | 13.5 | 14.5 | 22.5 | 20.6 | 20.7 | 14.0 | 8.7 | 32.5 | 18.5 |
| Unarmed robbery | 21.1 | 15.8 | 18.0 | 22.1 | 21.6 | 12.3 | 8.0 | 36.2 | 18.2 |
| 2019 | |||||||||
| Homicide | 1.4 | 1.4 | 1.6 | 2.0 | 1.7 | 1.7 | 1.3 | 4.5 | 1.6 |
| Sexual assault | 76.6 | 136.1 | 87.6 | 95.4 | 105.6 | 88.5 | 39.5 | 144.0 | 105.9 |
| Armed robbery | 28.4 | 14.9 | 30.7 | 26.2 | 23.3 | 19.5 | 16.5 | 26.8 | 22.8 |
| Unarmed robbery | 25.5 | 20.5 | 27.8 | 25.2 | 27.4 | 15.0 | 6.9 | 31.7 | 23.6 |
Crime rates compared to other jurisdictions – victims per 100,000 people