The Aboriginal and Torres Strait Islander Voice to Parliament referendum in October was defeated 60.1 per cent against. While many commentators argued at the time that the Voice referendum failed because of racism, a new survey from the Australian National University (ANU) suggests that the government’s proposed model, rather than attitudes to First Nations people, was the sticking point for voters.
Described as the most comprehensive study of the referendum and why it was rejected, the survey tracked 4,200 voters since January.
The Voice referendum asked Australians to vote ‘yes’ or ‘no’ to the question: “A Proposed Law: to alter the Constitution to recognise the First Peoples of Australia by establishing an Aboriginal and Torres Strait Islander Voice. Do you approve this proposed alteration?”
Only 39.9 per cent of Australians voted in favour of the proposed Voice. All states and territories also voted against it – except the ACT. Here, 61.3 per cent of residents voted in favour of the Voice.
“The data suggests that [66 per cent of] Australians voted no because they didn’t want division and remain sceptical of rights for some Australians that are not held by others,” the ANU’s Detailed analysis of the 2023 Voice to Parliament Referendum and related social and political attitudes states.
“The data suggests that Australians think that Aboriginal and Torres Strait Islander Australians continue to suffer levels of disadvantage that is both caused by past government policies and that justified extra government assistance,” the study continues. “They did not see the Voice model put to them as the right approach to remedy that disadvantage.”
Despite the defeat of the referendum, 87 per cent of Australian voters – including 76 per cent of ‘no’ voters – think Aboriginal and Torres Strait Islander people should have a voice/say on matters that affect them.
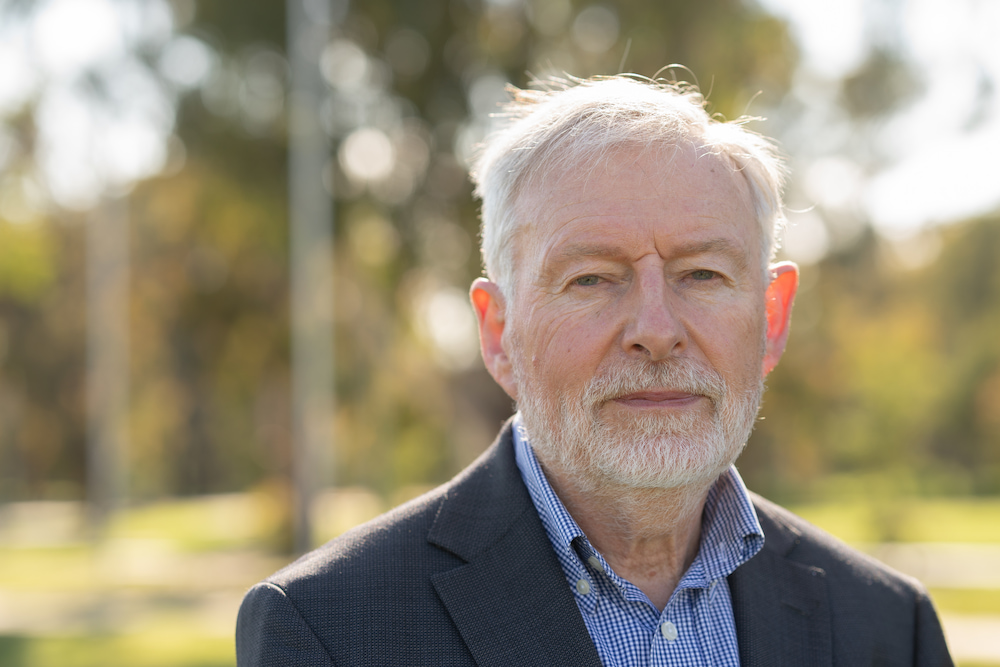
“This is one of the biggest paradoxes of this referendum result,” study co-author Professor Nicholas Biddle, Associate Director of the ANU Centre for Social Research and Methods, said.
Similarly, the ANU study found “no evidence … to suggest that Australians are against the idea of constitutional recognition in general”. When asked whether they would vote for Indigenous recognition in the Constitution without establishing the Voice to Parliament, five times as many people would have voted ‘yes’ (41.5 per cent definitely, 14.7 per cent probably) than those who would have voted ‘no’ (9.2 per cent definitely, 5.4 per cent probably).
While the study found no evidence that Australians opposed reconciliation, Aboriginal and Torres Strait Islanders having a voice / say in matters that affect them, or truth-telling processes, or lacked pride in First Nations cultures, voters’ perceptions on the rights of Aboriginal and Torres Strait Islander people nevertheless contributed to the referendum’s defeat.
“Many Australians feel that special rights for Aboriginal and Torres Strait Islander Australians are unfair,” Professor Biddle said. “A sizable number of Australians also think that the reason for Aboriginal and Torres Strait Islander disadvantage is a lack of effort.
“Those Australians who hold these views were far more likely to vote no than those that did not.”
However, most Australians (79.4) per cent think that the Federal Government should help improve reconciliation; and 80.5 per cent think Australia should “undertake formal Truth-telling processes to acknowledge the reality of Australia’s shared history”.
Demographic patterns
The ANU’s study provides an insight into the demographics of ‘yes’ and ‘no’ voters.
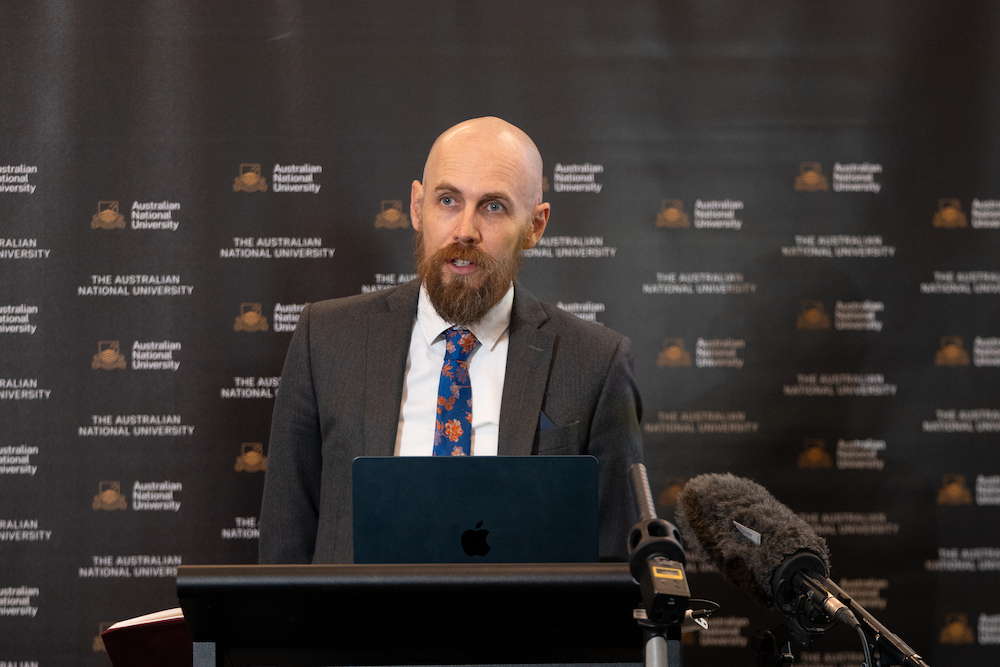
“The ‘yes’ vote was predicted by 4Gs – gender, generation, graduation and geography,” study co-author Professor Ian McAllister, Distinguished Professor of Political Science, said.

Women (43.2 per cent) were more likely to vote ‘yes’ than men (36.5 per cent). Younger voters, aged 18 to 24, were more than twice as likely (58.6 per cent) to vote ‘yes’ than those aged 75 or older (24.2 per cent). People with degrees were more than two and a half times as likely to vote ‘yes’ than those who had not completed Year 12.
Whereas, Professor McAllister noted: “‘No’ voters were more likely to be male, older, speaking a language other than English at home, with low levels of education, living outside of capital cities, and living in low-income households.”
Changing views
The study tracked voters’ views between January and October, and found that very few people switched from voting ‘no’ to ‘yes’ during the referendum campaign.
22.3 per cent of Australians intended to vote ‘yes’ in April or August, but eventually voted ‘no’ – more than five times the percentage of voters that eventually voted ‘yes’, but at some stage had considered voting ‘no’.
Only 4.8 per cent of those who, in January, said they would vote ‘no’ ended up voting ‘yes’.
Conversely, 42 per cent of those who in January said they vote ‘yes’ ended up voting ‘no’.
Support for the Voice fell most among those who spoke a language other than English at home; less educated voters; and those with lower incomes, Professor McAllister remarked.
The ‘yes’ vote declined among Coalition voters fell to roughly one-quarter of what it was in January – much more for those who would have voted for the Coalition than for Labor or minor party/undecided voters.
The survey also looked at how political attitudes changed over the campaign. Confidence in government, satisfaction with the direction of democracy, and trust in some institutions declined over 2022 and 2023.
“Declines were greater for those who voted ‘yes’ in October 2023 than those that voted ‘no’, and there is clearly an interaction between voters’ views on political issues and how they ended up voting,” Professor Biddle said.


